We recently welcomed our new family member Qiuqiu (球球) (a girl Syrian/Golden hamster) home. She seems to enjoy the new environment fairly well, but she is a quiet girl - does not show much activities during the day time.
Of course we understand hamsters are nocturnal animals, which means they are sleeping in day time and become more active at night. But I started wondering how she was doing during the nights, especially how much she ran on the hamster wheel.
Let’s do something about it.

Picture: Qiuqiu with her wheel
1. Hardware
There are many possible ways to track the hamster wheel.
- Wired solution, attach wire and switch to the wheel
It should work pretty straight forward, but I am not a fan of having wires going through the cage for connecting to the computer. Also Qiuqiu will definitely chew on the wires. - Wireless solution, with computer vision
This can be a pretty cool idea: Draw a mark (e.g. a red X) on the wheel, then place a camera (ie. AWS DeepLens) to run some computer vision tasks, for counting the wheel cycle.
I like this idea because it requires minimal work on the wheel and no dangerous for the hamster at all. But there also are some challenges such as how to ensure the image quality if there is no light in the room, or the wheel is running too fast to get a stable high quality image. - Wireless solution, with wireless sensor
This is what I did - need to attach a sensor on the wheel, but the sensor is so small that can be well protected in a shell. I decided to use zigbee protocol as I already have a smart home system that is well integrated.
1.1 Needed hardware
- Sensor: Aqara Door and Window Sensor
- Zigbee gateway: Conbee II
- PC/Laptop/Raspberry Pi
1.2 Installation
1.2.1 Place the sensor
Carefully place the sensor on the wheel and the body, make sure when wheel spins, the magnet on the wheel has a small but close enough gap with the sensor body. Used lego part for some adjustments.

1.2.2 Test with realtime sensor reading
Before we continue, I would like to test in action, to make sure the gap is OK. It is possible monitor realtime reading of the sensor, by using the Conbee API.
I wrote a simple web app (source code) with javascript and WebSocket, to visualize the realtime reading. The WebSocket API is provided by the Conbee application, see the document here.
Under the hood:
1.2.3 Mount the protective shell
I made a protective shell from a spare plastic box, and mounted on the wheel. Therefore Qiuqiu cannot chew on the sensor. I even made a small hole on the shell to easily use a stick for pressing the sensor reset button, without remove the whole thing.

2. Software
2.1 Manual data export
The BeeCon 2 is a USB-based zigbee gateway that can be attached to a PC or raspberry pi. It talks to the zigbee mesh network and receives signals from sensors. For example, the sensor on the wheel send the following json payload, one for “close” event (magnet and sensor are closed) and another one for “open” event (magnet and sensor are parted). Logically one open-close event pair indicates a finished cycle:
1 | { |
By connecting Conbee gateway with Home Assistant via deCONZ integration, it is fairly easy to export the data as a CSV file. (I plan to build a data pipeline with time series database in the later stage, but for now let’s stay with manual data export.)

Picture: exported csv, with 4 columns
2.2 Data analytics
2.2.1 Data loading and transformation
Now it is time for having some python/jupyter notebook fun. Here we are going to use https://www.kaggle.com/. You can read more comparison of online jupyter notebook hosting at here.
The above code snippet does:
- Load CSV file into pandas DataFrame, with needed 2 columns ‘last_changed’ and ‘state’
- During loading, parse datetime and also set last_changed as index
- Convert fixed string value “on”/“off” in ‘state’ to digital 0/1 in ‘finshedOneRound’ that can be used for plot
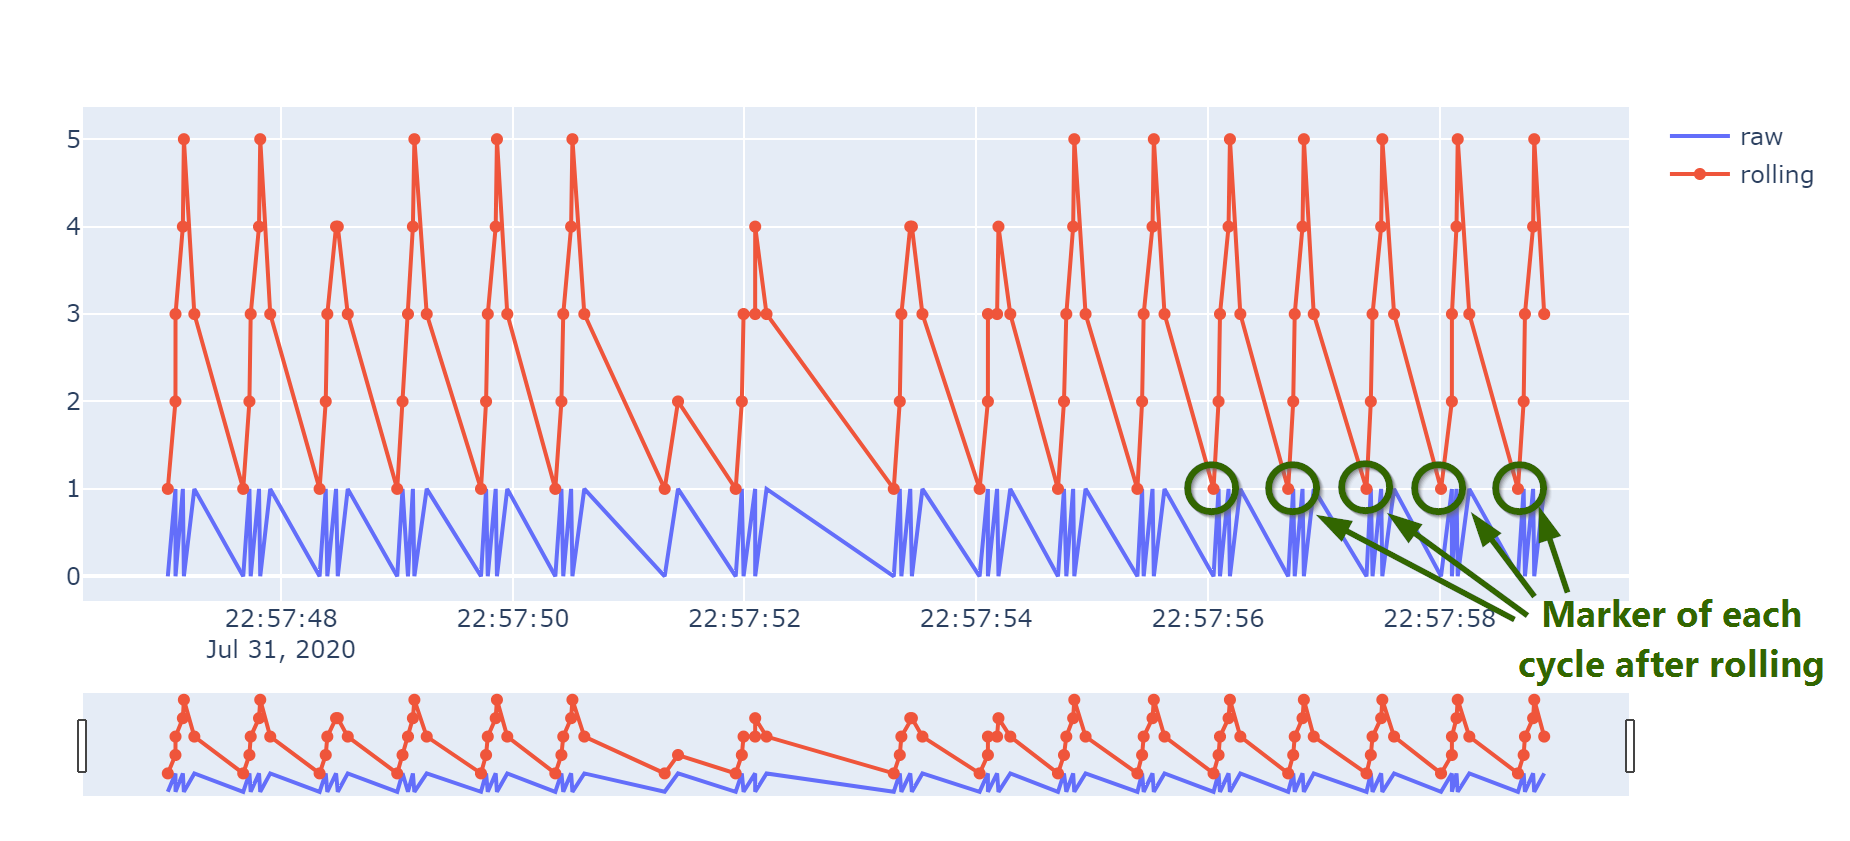
2.2.2 Check the raw data and noises
Let’s take a look at the raw data. The first thing I noticed is the “noise” of each cycle. As the door-window close sensor is not designed for tracking a spin, whenever a cycle finished, instead of report simple 2 events: on and off, it actually generates a sequence of events: on-off-on-off-on-off. This is a “noise” that we need to take care of.
it is worth noting that not all cycles follow the same pattern. For example, the 3rd red circle on the screenshot shows an exception: it only has one “on-off” event pair.

2.3 Noise reduction by rolling window calculations
We need a way to “group” the multiple events (“on-off-on-off-on-off”) into one event that indicates a cycle, but we cannot group by a fixed pattern as there are exceptions (as we mentioned above).
After some quick research and testing, without diving into hard-core data science part, I found the rolling window calculation can be a solution for our case.
Lets set the rolling windows to 150 ms - it is “magic number” that works good with the raw data. It purely depends on how fast the hamster runs.
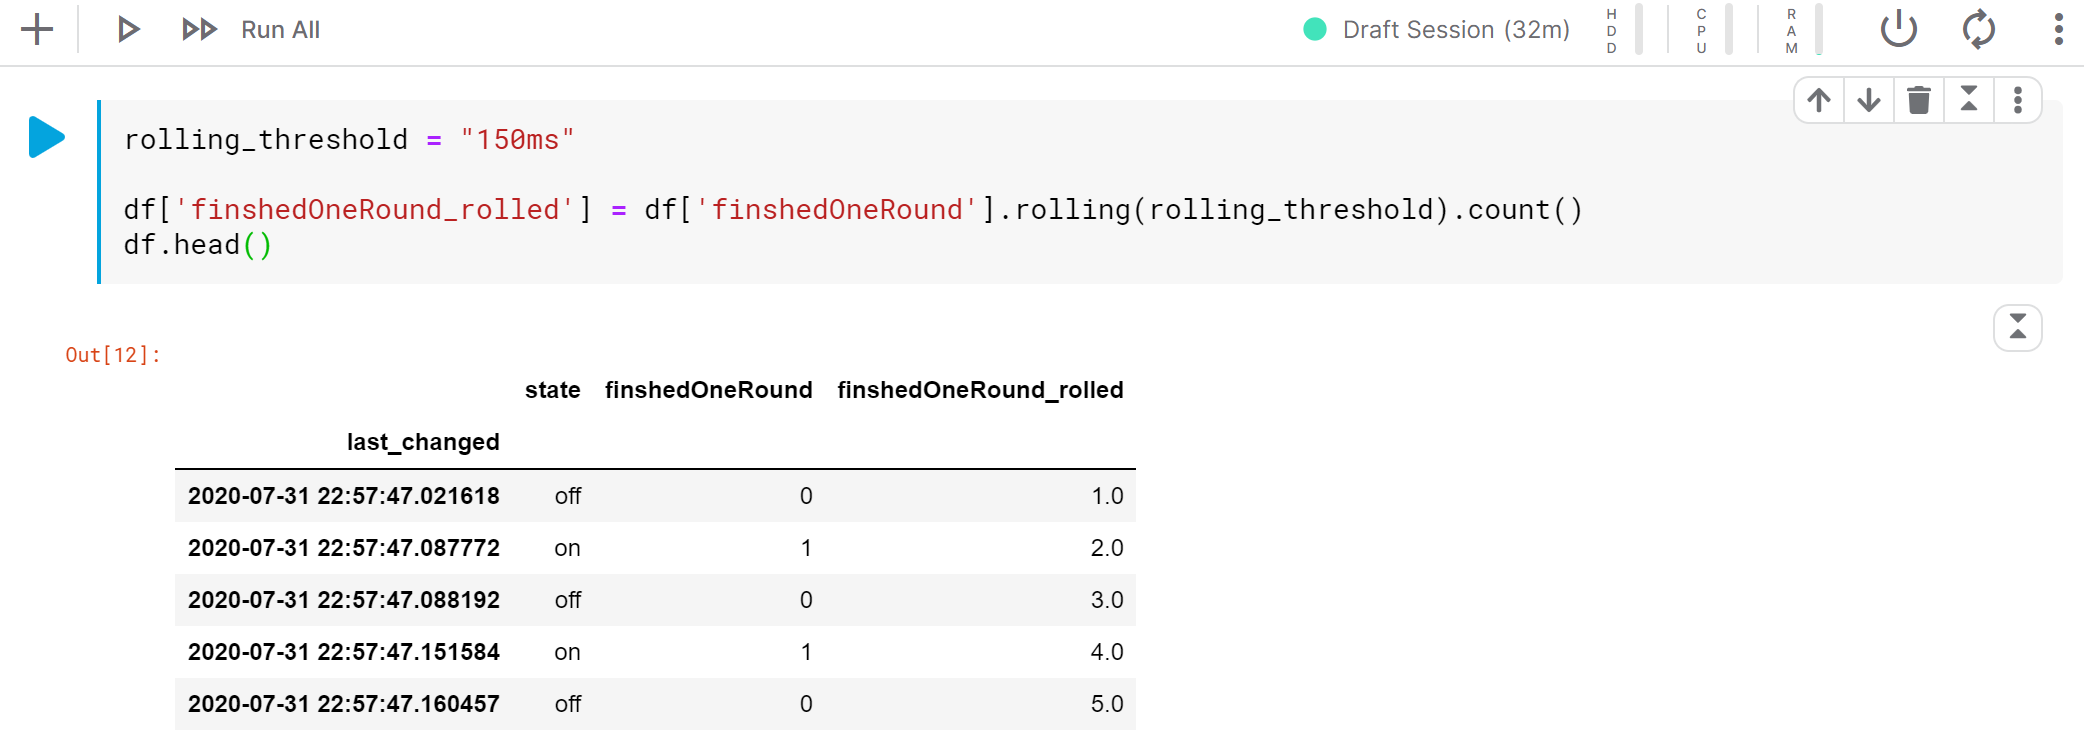
Lets visualize the rolling calculation results.
1 | import plotly.graph_objects as go |
Now you can see that the result of rolling calculation does generate unique markers for each cycle (the green circles), and it works for different patterns in the raw data!
Extract the markers (where rolling result == 1) into a new dataframe df_cycle_log for the next step.
1 | df_cycle_log = df.loc[df["finshedOneRound_rolled"] == 1] |
2.4 Calculation and visualization for the final result
I would like to know:
- When did Qiuqiu run?
- How far did she run?
- What was the speed?
- What kind of running pattern she has? (sprint or marathon?)
Lets do some match and populate the results:
1 | import math |
Then plot
1 | import plotly.graph_objects as go |
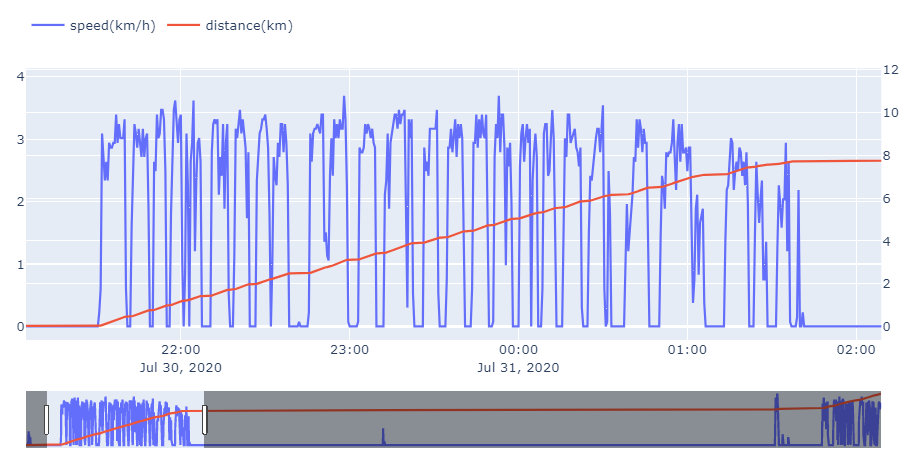
Conclusion from the result:
- When did Qiuqiu run?
She mainly ran for about 4 hours, between 21:30 and 01:30 UTC time (or 23:30 and 03:30 Oslo time). - How far did she run?
During these 4 hours, she ran about 7.74 KM (12315 cycles). - What was the speed?
Average speed was about 3KM/h, with a peak 3.7 KM/h. - What kind of running pattern she had? (sprint or marathon?)
She typically ran 5 minutes sprints, and took 2 min small breaks between them.
According to the internet, Qiuqiu is not the fastest runner (a hamster can run up to 5-9 KM/h), and also ran slightly less than average range 9 KM in that evening.
Of course the speed/range can vary from hamster to hamster, and this is data for one evening. The next step is to build a fully automated data pipeline with time series database, create some Grafana dashboards with daily/weekly baseline for long term tracking.
Thanks for the reading.