Introduction
Application Insight is a great tool for monitoring your application. However, there is a limitation regarding historical data: Regardless the different plans, you can only have:
- 7 days raw data, includes access to all telemetry data points collected by application insights
- 90 days aggregated data, includes access to telemetry data points aggregated at hourly/daily levels
This article will demonstrate how to use the continuous data export to overcome this limitation, as well as use PowerBI for future web analytic.
Export the data#
There is a nice document for enabling the continues export from Application Insights.
Create a storage account##
Currently, Application Insights can only export to a classic storage account. When you are creating it, I suggest to use “Standard-LRS“ with Cold tier. This is simply because we use storage account as a temporary storage place, before we move everything to a database.
Configure the export settings
In this case, we are exporting two types:
- Availability
- Page View.

Once it is done and the telemetry data started exporting, you should be able to see folders in the blob container in storage account. One folder is mapping to one data type in above export setting.

Take a closer look at the folder content. Below screenshot shows the PageViews data between 12am to 1pm on 28th of Sept.

Something keep in mind:
- The date and time are UTC and are when the telemetry was deposited in the store - not the time it was generated.
- Each blob is a text file that contains multiple ‘\n’-separated rows.
- It contains the telemetry processed over a time period of roughly half a minute. It means that each folder will have about 100 to 120 files.
- Each row represents a telemetry data point such as a request or page view.
- Each row is an JSON document. The detailed data structure can be found at here.
With the nice Azure Storage Account Explorer, it is pretty easy to check the content of the blob file.
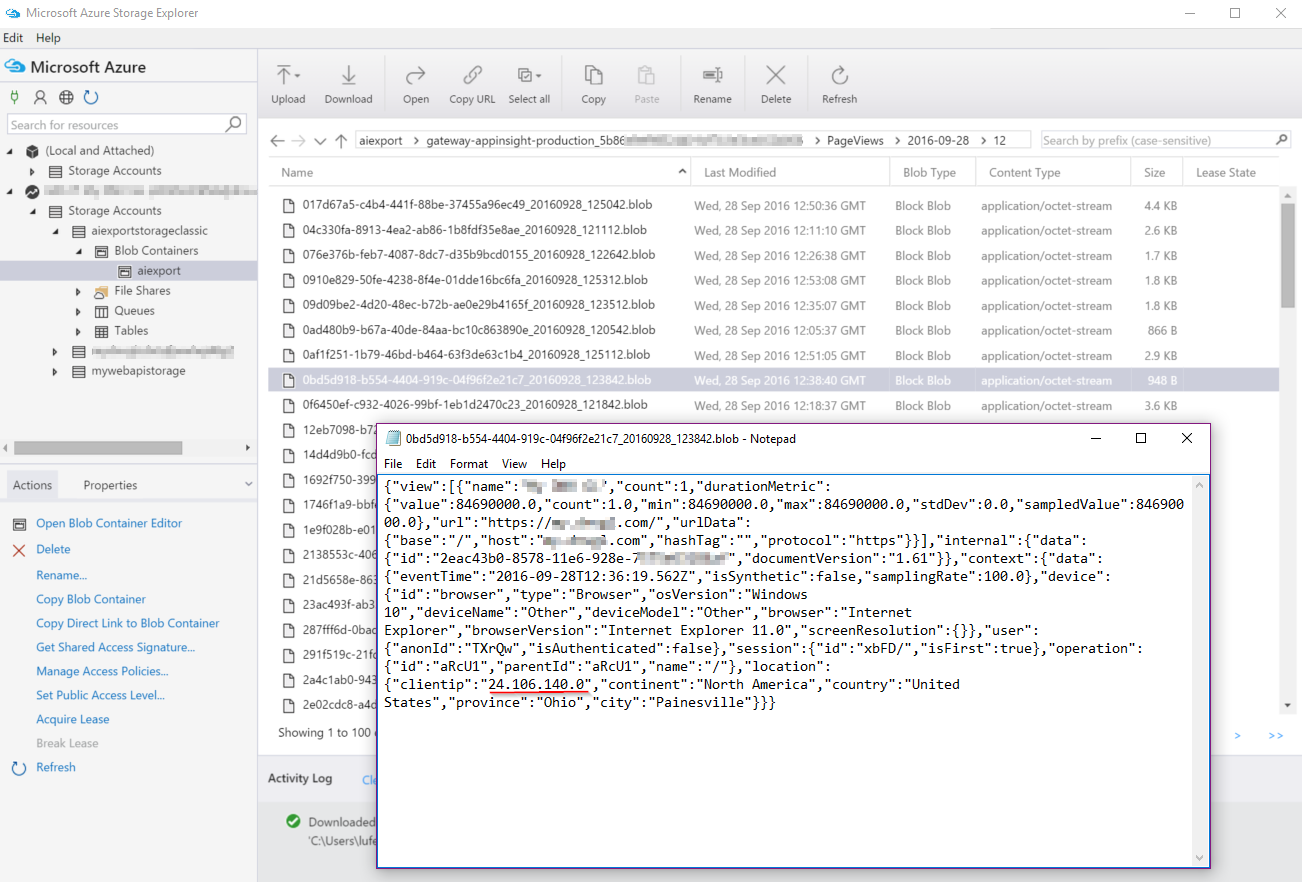
Please note that Application Insights also implemented the same logic as IP Anonymization in Google Analytics. For all IP address that is collected by Application Insights, last octagon is anonymized to 0 (you can see the highlighted in above screenshot).
Transfer and store the data#
They are many ways to transfer the data out from storage account. Here we are going to use Streaming Analytics.
Once the streaming analytic instance was created, setup the inputs. We will need 2 inputs for both Availability and PageViews. This is because their data structures are different, and requires different handling.
Setup inputs
Talk about the Path Pattern first
According to the document, the Path Pattern property of input should follow format (yourApplicationInsightName)_(yourkey)/(yourTelemtryType)/{date}/{time}.
Firstly, the (yourApplicationInsightName)_(yourkey) part can be simply copied from the storage account page.

Secondly, please note that the yourTelemtryType (in this case, PageViews and Availability) is case sensitive!
Finally, make sure the date format is “YYYY-MM-DD”, not the default “YYYY/MM/DD”.
Input of PageViews and Availability

Test the sample data
You should always verify the input settings by test the sample data. For example, if we forgot the set data format, you will get below error.

** Keep the downloaded sample data for later usage **

Error message:
No events found for ‘ai-pageviews’. Start time: Thursday, September 29, 2016, 1:00:00 AM End time: Friday, September 30, 2016, 1:00:00 AM Last time arrival: Thursday, January 1, 1970, 1:00:00 AM Diagnostics: While sampling data, no data was received from ‘1’ partitions.
Setup outputs
Create an Azure SQL database
Let’s create an Azure SQL database. In this case I have created one with the cheapest plan: 40 NOK/Month, and up to 2GB storage.
Make sure you setup the firewall that allows
- Azure service access. It will be used by Streaming Analytic Job and Power BI.
- Your client IP address. You will need that for creating tables.

Create table schema
According to the telemetry data structure definition, you can create a DB table that stores the telemetry data which you are interested.
Availability
Now let’s create a table that stores availability.
You can follow above document, or simply have a look at the data you have, and only pickup the fields that you need, as below (Needed fields are highlighted)

1 | CREATE TABLE [dbo].[ai-availability] |
PageViews

1 | CREATE TABLE [dbo].[ai-pageviews] |
Setup outputs in Streaming Analytic

Setup transferring
Now we are ready to setup the transferring query.
At this moment, the new Azure portal does not support query test (always grayed out), so let’s head to Azure classic portal, and test our query.
The detailed input data structure can be found in the previously downloaded sample file.

Setup query
Below query will transfer telemetry data of both Availability and Pageviews.
1 | SELECT |
Verify the query
Use the test function to ensure the query is OK.

Test run
Now it’s time to have a test run: start your stream analytic job and pay attend to the input vs output numbers: they should be approximately 1:1.

If not, check the logs:

As you can see, the problem is the string we got from input is too long. A quick fix is to reduce the length during the transfering as below:
1 | SELECT |
Now you are done with the stream analytic part, and all telemetry data will be continuously exported to your Azure SQL database.
Visualize your data
PowerBI is a good tool for data visualization and sharing.
Before we dive into PowerBI, we will have to do some preparation as below:
Creating a time series
In order to show the data in time series, we will have to create a temporary dataset, which contains hour-by-hour time series in last 7 days.
1 | DROP FUNCTION PreviousHourSeries; |
Start working on PowerBI
- You will connect PowerBI desktop to the Azure SQL database, includes pageviews and availability tables, plus the time series function.

- Format the timestamp column in a format that can join with time series table.
 You will have to remove the hours from the timestamp, such as
Availability: TimeStampInHourFormat = FORMAT(‘ai-availability’[timestamp], “yyyy-mm-dd HH:00”)
PageViews: TimeStampInHourFormat = FORMAT(‘ai-pageviews’[timestamp], “yyyy-mm-dd HH:00”)
PreviousHourSeries: HourlySeriesInFormat = FORMAT([HourlySeries], “yyyy-mm-dd HH:00”) - Manage the relationship between them
- Start creating charts. Remember to set HourlySeriesInFormat to “show item without data”, and hide items that HourlySeriesInFormat is Blank (means it is out of the time series scope. It is too old)
