feng.blog();2023-05-23T09:06:59.769Zhttps://feng.lu/Feng LuHexoAWS Blog - Manage IoT device state anywhere using AWS IoT Device Shadow service and AWS IoT Greengrasshttps://feng.lu/2023/05/23/Manage-IoT-device-state-anywhere-using-AWS-IoT-services/2023-05-23T08:34:20.000Z2023-05-23T09:06:59.769ZDiscover my latest blog post on AWS official blog channel, where I delve into managing IoT devices from anywhere! Whether you’re interested in a humble Raspberry Pi application or eager to explore broader applications like home automation or industrial IoT solutions, this post has got you started.
Demo 1: Update the device locally by using joystick
Demo 2: Update the device remotely by updating device shadow document in cloud
]]>
<p>Discover <a href="https://aws.amazon.com/blogs/iot/manage-iot-device-state-anywhere/">my latest blog post</a> on AWS official blog channel, where I delve into managing IoT devices from anywhere! Whether you’re interested in a humble Raspberry Pi application or eager to explore broader applications like home automation or industrial IoT solutions, this post has got you started.</p>
<p>Happy reading!</p>
<p><a href="https://aws.amazon.com/blogs/iot/manage-iot-device-state-anywhere/"><img src="/2023/05/23/Manage-IoT-device-state-anywhere-using-AWS-IoT-services/AWS%20IoT%20Blog.png" class=""></a></p>
<p><strong>Blog address</strong>: <a href="https://aws.amazon.com/blogs/iot/manage-iot-device-state-anywhere/">https://aws.amazon.com/blogs/iot/manage-iot-device-state-anywhere/</a><br><strong>Source code</strong>: <a href="https://github.com/aws-samples/manage-IoT-device-using-device-shadow-blog">https://github.com/aws-samples/manage-IoT-device-using-device-shadow-blog</a> </p>
AWS Step Functions with ECS Anywhere on NanoPi Samplehttps://feng.lu/2022/02/02/AWS-Step-Function-with-ECS-Anywhere-on-NanoPi-Sample/2022-02-02T13:31:24.000Z2022-02-02T13:47:14.111ZThis is a demo solution that is using AWS Step Functions and ECS Anywhere to complete a simple data processing task by using cloud orchestration (Step Functions) and local computing resources (a NanoPi).
Data flow
User upload a file to a s3 bucket
S3 triggers step functions via cloudtrail and event bridge
Event bridge triggers a step function state machine
State machine triggers a ECS Anywhere task to download the file from s3 to local (to do some processing), if file name matches condition
Architecture
NanoPi that runs ECS Anywhere
NanoPi Neo2 with LED hat in my home office, running AWS ECS Anywhere.
The CHOICE step check the file key and trigger the ECS task ONLY IF the file key matches “demo*.txt”
(4). ECS RunTask
This ECS RunTask update the input paramater (adding s3:// prefix to bucket name), then pass the parameters to ecs Anywhere task via environment variables.
(5). End
Once the ecs Anywhere task is finished, the downloaded file can be found in the ecs Anywhere local file system (in this case, the file is in /data)
4. Side notes
In ECS RunTask in Step Functions, override command cannot pass multiple parameters. In our case we would like to use aws cli docker for simple aws cli s3 download. However if we override the command to “s3 cp x y” in ECS RunTask step in State Machine, these 4 parts will NOT be passed as individual 4 parameters but ONE parameter that contains all. AWS cli cannot accept that.
Incorrect value that passed via override command
1 2 3
"Args": [ "s3 cp x y" ]
Correct call if we directly use aws cli docker from terminal
1 2 3 4 5 6
"Args": [ "s3", "cp", "x", "y", ]
Therefore we use environment variables to make sure we can pass parameters to ecs container task separately (it means we have to use our own container)
]]>
<p>This is a demo solution that is using <a href="https://aws.amazon.com/step-functions/">AWS Step Functions</a> and <a href="https://aws.amazon.com/ecs/Anywhere/">ECS Anywhere</a> to complete a simple data processing task by using cloud orchestration (Step Functions) and local computing resources (a NanoPi). </p>
<h2 id="Data-flow"><a href="#Data-flow" class="headerlink" title="Data flow"></a>Data flow</h2><ol>
<li>User upload a file to a s3 bucket</li>
<li>S3 triggers step functions via cloudtrail and event bridge</li>
<li>Event bridge triggers a step function state machine</li>
<li>State machine triggers a ECS Anywhere task to download the file from s3 to local (to do some processing), if file name matches condition</li>
</ol>
<h2 id="Architecture"><a href="#Architecture" class="headerlink" title="Architecture"></a>Architecture</h2><img src="/2022/02/02/AWS-Step-Function-with-ECS-Anywhere-on-NanoPi-Sample/architecture.png" class="" title="architecture">
<h2 id="NanoPi-that-runs-ECS-Anywhere"><a href="#NanoPi-that-runs-ECS-Anywhere" class="headerlink" title="NanoPi that runs ECS Anywhere"></a>NanoPi that runs ECS Anywhere</h2><img src="/2022/02/02/AWS-Step-Function-with-ECS-Anywhere-on-NanoPi-Sample/nanopi.jpg" class="" title="nano pi">
<p><a href="https://wiki.friendlyarm.com/wiki/index.php/NanoPi_NEO2">NanoPi Neo2</a> with LED hat in my home office, running AWS ECS Anywhere.</p>
Using SSM to access EC2 instanceshttps://feng.lu/2021/12/17/Using-SSM-to-access-EC2-instances/2021-12-17T08:34:22.000Z2022-07-04T12:54:35.798Z1. Benefits of using for connecting EC2 instances
AWS Systems Manager (SSM) is an AWS service that you can use to view and control your infrastructure on AWS. It can securely connect to a managed node. The SSM Agent is installed in EC2 OS. It is pre-installed on many amazon Machine Images (AMIs).
With SSM:
No need to open SSH port in security group for EC2
No need to create and manage SSH keys
And SSM works regardless if the EC2 instance is in public or private (NAT or Endpoint) subnet.
Requirements for SSM working:
AWS instances:
SSM agent installed in instance (pre-installed in many AMIs already)
Connectivity to the AWS public zone endpoint of SSM (IGW, NAT or VPCE)
IAM role providing permissions
On-Prem instances:
SSM agent installed in instance
Connectivity to the AWS public zone endpoint of SSM (Access to public internet)
Activation (Activation Code and Actuation ID)
IAM role providing permissions
2. EC2 Instance in public subnet
2.1. Make sure the EC2 instance has a public IP. It could be the public IP assigned during creation, or an Elastic IP.
2.2. EC2 instance should have Internet access (for calling SSM endpoint). In public subnet it is done via Internet Gateways. See details from Session Manager prerequisites, in “Connectivity to endpoints” section.
2.3. You can use VPC Reachability Analyzer to troubleshoot the connectivity between your EC2 and Internet gateway.
2.5 Attach the EC2 Instance profile to your instance.
2.6 Reboot the EC2 instances.
3. EC2 instance in private subnet, with NAT connectivity
In this case, EC2 instances have no public IP, but they can still talk to internet via NAT.
3.1. Make sure EC2 instances in private subnet can access internet, via a NAT Gateway or NAT instance.
3.2. The rest will be the same as EC2 instances in public subnet, starting from 2.2
4. EC2 instance in private subnet, without NAT connectivity but VPC endpoints
In this case, the EC2 instance (no public IP) won´t have access internet via NAT but VPC endpoints, some extra works are required
4.1 Create VPC endpoints for System Manager. Remember to allow HTTPS (port 443) outbound traffic in security group for your endpoint (ssm, ssmmessages and ec2messages)
4.3 Attach this instance profile to your EC2 instance
4.4 Make sure enable “DNS resolution” and “DNS hostnames” for you VPC
4.5 In addition, if your EC2 instance need to access other AWS services such as S3, remember to create needed endpoints for them as well. (For S3 you can choose either Gateway or Endpoint. At this moment Gateway is free.) Note that you need to add the endpoint into the private subnet route table. The following screenshot shows the route table entity of a S3 Gateway endpoint, which is using prefix lists.
5. Verification
Once the SSM is fully up-and-running, the EC2 instance (either in public/private subnet) will appear in Fleet Manager in SSM web console.
]]>
<h2 id="1-Benefits-of-using-for-connecting-EC2-instances"><a href="#1-Benefits-of-using-for-connecting-EC2-instances" class="headerlink" tit
Building a Very Slow Movie Playerhttps://feng.lu/2021/12/04/Building-a-Very-Slow-Movie-Player/2021-12-04T10:23:19.000Z2021-12-04T13:52:59.963ZInspired by Bryan Boyer and Tom Whitwell, I am building a Very Slow Movie Player (VSMP).
With VSMP,
Kiki’s Delivery Service (running time 1h42m): takes 7 days to play (with 1 frame per 20 seconds, as in above demo)
Laputa: Castle in the Sky (running time 2h4m): takes 2 months to play (with 1 frame per 120 seconds, as default setting)
Install standard Raspberry OS. I am using the 32bit bulleyes with desktop version, but someone suggested to use lite version for Raspberry Pi Zero. Read more here.
For install pi with headless wifi, read how-to here.
Note: It is a good practice to disable the default user “Pi”, but VSMP installation script from Tom Whitwell is using hard-coded “Pi” home path, so to keep it simple, keep “Pi” user but DEFINITELY update the default password. I also run it in a guest wifi that it has no access to rest of my network devices.
Also you might want to re-encode the videos as here.
5.2 Shoot a video for your VSMP
You can use iphone time-lapse to record your VSMP to see how it works. However, iphone time-lapse will sometimes capture some e-paper refresh, when the screen is all white or black. To remove these bad frames from your video, do following (ref #1, #2)
1 2 3 4 5 6 7 8 9 10 11 12
# extract all frames from iphone time-lapse video mkdir img ffmpeg -i time-lapse.MOV -qscale:v 2 -r 30/1 img/img%03d.jpg #iphone time-lapse video is 30 fps, second best output img quality
# remove bad frames # manual or using ML such as Amazon Lookout For Vision
# regenerate the video from frames ffmpeg -framerate 30 -pattern_type glob -i 'img/*.jpg' output.mov
# slow it down if needed ffmpeg -i output.mov -filter:v "setpts=1.3*PTS" output_slow.mov
]]>
<p>Inspired by <a href="https://medium.com/s/story/very-slow-movie-player-499f76c48b62">Bryan Boyer</a> and <a href="https://debugger.medium.com/how-to-build-a-very-slow-movie-player-in-2020-c5745052e4e4">Tom Whitwell</a>, I am building a Very Slow Movie Player (VSMP).</p>
<img src="/2021/12/04/Building-a-Very-Slow-Movie-Player/vsmp-demo.gif" class="" title="vsmp demo">
<p>With VSMP, </p>
<ul>
<li>Kiki’s Delivery Service (running time 1h42m): takes 7 days to play (with 1 frame per 20 seconds, as in above demo)</li>
<li>Laputa: Castle in the Sky (running time 2h4m): takes 2 months to play (with 1 frame per 120 seconds, as default setting)</li>
</ul>
Okta and AWS Control Tower - a happy path demohttps://feng.lu/2021/11/17/Okta-and-AWS-Control-Tower-a-happy-path-demo/2021-11-17T19:17:08.000Z2021-12-17T10:15:02.082ZThis is a happy path demo of setting up Okta as the Idp for AWS Control Tower (via AWS SSO). Goal: To utilize users and groups in Okta to manage AWS control tower.
1. Create a brand new Control Tower instance
In this demo, we create the AWS Control Tower instance in a brand new AWS account. During this process, control tower creates several services/components, such as AWS Organizations, AWS SSO, default organizations unit (OU) “Security” and 2 AWS accounts “Log Archive” and “Audit”.
In the AWS SSO, some default SSO user groups are created for managing Control Tower:
The default admin user for organization management account is “AWS Control Tower Admin”.
Detailed user info
And it belongs to 2 groups: AWSAccountFactory and AWSControlTowerAdmins
Follow the steps in the following document, to use Okta as the idp of AWS SSO. Note that you need to check steps from both documentation to make sure the integration and user provisioning works.
2.2.1 Basic hand-shake, import metadata file from Okta to AWS SSO
2.3 The basic setup is ready, but not for users and groups yet
After the basic hand-shake between AWS SSO and Okta, the AWS SSO is now using Okta.
In Okta groups UI, you can see identical groups as in AWS SSO are created in Okta. The Everyone is a default Okta user group.
Note: you cannot add/remove users to it, as it says “This group is managed automatically by Okta, so you cannot edit it or modify its membership.”
3. Setup Okta users and groups, push them to AWS SSO
3.1 Create user and groups in Okta
Lets create some test users:
We also create user groups in Okta
AWS-CT-Admin-Okta-Group, has 1 user: Feng
AWS-CT-Developers-Okta-Group has 2 users: Alice and Bob
However, they are not appearing in AWS SSO user list. There is still no Okta user nor Okta group.
In order to user the users from Okta, these users need to be assigned to AWS SSO Application in Okta.
3.2 Assign users and/or groups in Okta
Go to Okta -> Application -> AWS SSO, in Assignments tab, you can either assign individual users or user groups. In this screenshot, all users are assigned to AWS SSO via Group (see the Type column).
Soon, you can see these 3 users appear in AWS SSO interface.
The detailed info. Note that it was created and updated by SCIM.
Now you can assign them into AWS account, so the user can login to AWS console via login to Okta.
3.3 Push groups from Okta to AWS SSO
Now we can grant permission for individual Okta users. But how about Okta group? These new okta groups are not available in AWS SSO yet. And the groups with identical names from AWS SSO is not helping, as we cannot add users into it.
To solve this, we need to push the Okta groups to AWS SSO by setting up the “Push Groups”.
Go Okta > Application > AWS SSO, in tab “Push Groups”, here you can push group by name, or setup roles for batch pushing.
In this demo, we setup a rule named “Pust-AWS-Related-Groups” for pushing any group that starts with “AWS-”
Soon, these groups were pushed to AWS SSO:
Now you can also grant permission to groups, such as every Okta user in AWS-CT-Admin-Okta-Group now have permission as AWS control tower admin.
EoF.
]]>
<p>This is a <a href="https://en.wikipedia.org/wiki/Happy_path">happy path</a> demo of setting up <a href="https://www.okta.com/">Okta</a> as the Idp for <a href="https://aws.amazon.com/controltower/">AWS Control Tower</a> (via <a href="https://aws.amazon.com/single-sign-on/">AWS SSO</a>).<br><strong>Goal</strong>: To utilize users and groups in Okta to manage AWS control tower.</p>
<img src="/2021/11/17/Okta-and-AWS-Control-Tower-a-happy-path-demo/title.jpg" class="" title>
<h1 id="1-Create-a-brand-new-Control-Tower-instance"><a href="#1-Create-a-brand-new-Control-Tower-instance" class="headerlink" title="1. Create a brand new Control Tower instance"></a>1. Create a brand new Control Tower instance</h1><p>In this demo, we create the AWS Control Tower instance in a brand new AWS account. During this process, control tower creates several services/components, such as AWS Organizations, AWS SSO, default organizations unit (OU) “Security” and 2 AWS accounts “Log Archive” and “Audit”. </p>
<p>In the AWS SSO, some default SSO user groups are created for managing Control Tower:<br><img src="/2021/11/17/Okta-and-AWS-Control-Tower-a-happy-path-demo/default%20SSO%20user%20groups.jpg" class="" title="default SSO user groups"></p>
<p>The default admin user for organization management account is “AWS Control Tower Admin”.<br><img src="/2021/11/17/Okta-and-AWS-Control-Tower-a-happy-path-demo/default%20master%20user1.jpg" class="" title="default master user1"></p>
<p>Detailed user info<br><img src="/2021/11/17/Okta-and-AWS-Control-Tower-a-happy-path-demo/default%20master%20user2.jpg" class="" title="default master user2"></p>
<p>And it belongs to 2 groups: <strong>AWSAccountFactory</strong> and <strong>AWSControlTowerAdmins</strong><br><img src="/2021/11/17/Okta-and-AWS-Control-Tower-a-happy-path-demo/default%20master%20user3.jpg" class="" title="default master user3"></p>
How to build an IoT connected car - Part 2: Data Analytics in the Cloudhttps://feng.lu/2020/09/22/How-to-build-an-IoT-connected-car-Part-2-Data-Analytics-in-the-Cloud/2020-09-22T08:00:13.000Z2021-11-17T19:10:29.523ZIn Part 1, we have talked about the hardware/software running on the edge (the car) for collecting data.
Now we have the data, and how to gain some insights by doing data analytics? I have been using the following products, and would like to share my quick thoughts
Azure Time Series Insight (TSI)
Azure Databricks
Azure Data Explorer (ADX)
PowerBI
Grafana
Please note that I tested these products back to Feb/March of 2019 and all the feedback were from that time point. I am sure all products were significate upgraded and improved since then, so you might wanna check them again with the lastest features.
1. Azure Time Series Insight (TSI)
Azure Time Series Insight (TSI) is an IoT analytics platform monitor, analyze, and visualize your industrial IoT data at scale. With native integration with Azure IoTHub or EventHub, it is easy to visualize and explore the IoT data such as from our connected car.
1.1 Simple data exploring
You can easily explore data by putting time series data into one screen: (click to enlarge) For example, you can identify the relationship between engine RPM and speed, and the increasing temperature of engine coolant.
1.2 Metadata/Model management
As TSI is built for handling IoT data, it has built-in functionality for managing metadata/models of IoT data stream. This is a unique feature that only TSI offers, compares to other general-purpose analytics products that I tried.
In another word, in order to use TSI, you will have to setup the following models:
Time Series Model instances
Time Series Model hierarchies
Time Series Model types(source: Microsoft)
For our case, we can setup the models for representing the
For our case, these model definitions can be found at here.
1.3 Summary of TSI experience
Pro:
Very nice user interface with animation, smoothly zoom in/out
Built-in support of data module/metadata
Supporting IoT data in scale (although I only tested with a small dataset)
Data can be exported to parquet files, which is optimized for time-series data
Con:
Limited analytic possibility, cannot run customized query in UI
Does not support map
Data model contextualization is done only via TSI API, not in parquet file (which is raw data)
Exported parquet file is somewhat messy (see more details in DataBricks section)
2. Azure Databricks
It was nice to visualize the time series data in TSI, but I would like to play more with the dataset, such as calculating the fuel consumption vs. speed for example. I would like to use python and jupyter notebook. Therefore I continue the work with Azure Databrick.
2.1 Simple plot of Speed vs RPM
2.2 Calculate the fuel consumption and eco-driving zone
# Then convert from MPG to L/100km, adding Consumption column, using US galoons l/100km = 282.48/MPG (imperial gallons) or l/100km = 235.21/MPG (US gallons) dfwithConsumption = dfwithMPG.withColumn("Consumption",235.21/dfwithMPG.MPG).select("timestamp", "series_SPEED_double", "series_RPM_double", "MPG", "Consumption")
(Picture: Oversimplified calculation of eco-driving zone)
2.3 Issue of TSI generated parquet files
If we directly use the TSI parquet files as input for the databricks, we will encounter an error message “Found duplicate column(s) in data schema: “series_speed_double”.
This is because both GPS and OBD modules are reporting speed, but with different case “Speed” and “SPEED”.
TSI is fine with it, as the asset model/metadata helps, but in Databrick there is no data contextualization - all data fields are flattened out, therefore it is quite often encountering this type of issue.
As a workaround, we can set spark.sql.caseSensitive as true
The standard tool/eco-system for data analytics, can do almost anything
Rich and powerful libraries
Con:
Not for ordinary business users who do not work with python/programming
Some visualization such as map and animation requires extra work
Tried PowerBI to databricks (spark), did not manage to make it work at that time (beta version)
No builtin data contextualization support, take the input as it is, which is an issue with TSI parquet files
3. Azure Data Explorer (ADX)
After tried the a-bit-too-simple TSI and a-bit-too-hardcore Databrick, I was looking for a better-balanced product between them. Therefore I started exploring Azure Data Explorer (ADX).
3.1 Setup database and ingestion mapping
Long story short, I created an ADX cluster and a database for IoT Car data, created 2 tables:
Missing some visualization such as map and animation
4. PowerBI
So far I have tried several products for analytics, but none of them have great built-in visualization features, especially on map support.
PowerBI is a popular tool for data visualization, but it does not support big data analytics. However, by combining PowerBI and ADX, the job is easier.
4.1 Let ADX to handle the computing part
Instead of doing the visualization in ADX, now we use a query to generate a dataset (two dimensional table)
NOTE: When I was testing this, there was an issue that the Kusto query can NOT have inline comments, otherwise these inline comments will be mixed into the generated powerBI query, which ruined the syntax. Keep all the comments out of the kusto query block.
4.2 In PowerBI, create good-looking visualization dashboard
By using the generated PowerBI query from above, I can easily create differnt visualization dashboard in PowerBI. For example the map: It shows one of the trips on the map, as well as the speed: greener is faster, and reder means slower.
Picture: Play a trip in PowerBI, with map and engine RPM.
X-axis: time
Y-axis: speed (from GPS)
Size of the bubble: Engine RPM (from OBD)
It clearly shows where was the traffic jam (drops of speed), and where had a good traffic condition (peak of speed and RPM).
4.4 Summary of PowerBI experience
Pro:
Easy to use
Rich visualization (e.g. map)
Easy to share (e.g. PowerBI Online)
Con:
Not for big data computing, but good for visualization
Need a “big data computing” back end (in our case it is ADX)
5. Grafana
PowerBI is a good visualization tool, but it is not easy to directly create/update kusto query in PowerBI. Most likely you will have to run and test the query in ADX, then export to PowerBI. We hope to overcome this issue with Grafana.
Grafana is an open source tool mainly used for monitoring and data visualization. With the Azure Data Explorer Datasource For Grafana plugin, we can integrate the ADX and Kusto power with fancy and powerful Grafana visualization.
5.1 Run Grafana as docker, with preinstalled ADX data source plugin
1
docker run -p 3000:3000 -e "GF_INSTALL_PLUGINS=grafana-azure-data-explorer-datasource" grafana/grafana:latest
Now you can directly create Kusto-enabled dashboard, including map.
5.2 Summary of Grafana experience
Pro:
Very rich and powerful visualization
Self-service Kusto enabled queries and build dashboard
Built-in access control and notification support
Big support by the community
Con:
(cannot find one…for now)
Conclusion
Now we have tried several products, and my favorite setup is ADX (as backend data storage and query) and Grafana (as front end self-service visualization). I believe it meet the most common needs of ordinary users. But of course other products have different focus areas and can/should be used for different scenarios.
After all, the old saying is always correct: “It depends.”
]]>
<p>In <a href="/2020/09/15/How-to-build-an-IoT-connected-car-Part-1-On-the-Edge/" title="Part 1">Part 1</a>, we have talked about the hardware/software running on the edge (the car) for collecting data.</p>
<p>Now we have the data, and how to gain some insights by doing data analytics? I have been using the following products, and would like to share my quick thoughts</p>
<ul>
<li>Azure Time Series Insight (TSI)</li>
<li>Azure Databricks</li>
<li>Azure Data Explorer (ADX)</li>
<li>PowerBI</li>
<li>Grafana</li>
</ul>
<img src="/2020/09/22/How-to-build-an-IoT-connected-car-Part-2-Data-Analytics-in-the-Cloud/Thumbnail.png" class="" title="Thumbnail">
How to build an IoT connected car - Part 1: On the Edgehttps://feng.lu/2020/09/15/How-to-build-an-IoT-connected-car-Part-1-On-the-Edge/2020-09-15T08:38:12.000Z2021-11-17T19:10:29.487ZPreviously I wrote a blog about how to measure hamster via IoT wheel. This reminds me another personal project I did back to the winter of 2018/2019, for measuring car performance.
Other articles in this series:
Part 1 (this article): Talk about the hardware/software running on the edge (the car) for collecting data.
Part 2: Talk about how to get insight from the data with different analytic tools.
1. Overview on the edge
1.1 Hardware
OBD2 USB connector OBD2 is an interface/protocol that is available for 1996 and newer vehicles. It reports various telemetries of the vehicle.
USB GPS dongle For collecting location information
Raspberry Pi Running Linux, Azure IoT Edge runtime and hosting 2 modules (OBD and GPS location)
USB Wifi dongle For connecting mobile phone hotspot
Mobile phone For realtime data uploading to the cloud via 4G
Power bank (optional) For powering up raspberry pi. Alternatively, you can use a 12V->5V adapter to use the car battery.
1.2 Software
Azure IoT Edge
Docker
Python
1.3 Dataflow and Architecture
2. Developing IoT Edge modules
2.1 Introduction
2.1.1 Design Principles
As there are many possible situations can happen on the edge, such as disconnection from OBD2 connector, or loss of GPS signal (when going through an underground tunnel), the modules are built with the following principles:
Design for failure
Auto healing
In addition, the modules are built into docker containers, together with Azure IoT Edge runtime, which makes it easier to deploy.
With a USB GPS dongle, it is quite easy to get the location information by using tools such as GPSD.
2.2.1 You have to dev/test in the field, not only in the office
I immediately met the first challenge: The USB GPS dongle requires a good open sky view to work well. The one that I used does not have an antenna, so I need to put the whole thing (raspberry pi + GPS dongle) outside of the building (or at least outside of the window).
Remind you that it was winter in Norway during that time, and I was not a fan of typing keyboard in the snow with -5 degrees.
Firstly, I have tried do this in my car: parked the car in an outdoor parking slot, put the raspberry pi on the dashboard and remote desktop to it. Well, it worked, GSP signal was strong, but it was quite difficult to type any keys behind the steering wheel :)
But soon I figured out a better solution on my balcony (see below picture), and that worked perfectly (as far as the wifi signal is good and the power bank battery did not die from the low temperature)
Now I can work from a warm cozy place and deal with the GPS data that is collected from the “cold box”.
2.2.2 Working with GPS data with python
The GPS receiver reports data as NMEA sentences, and we are combining GGA and RMC.
Here we are using a python lib pynmea2 for handling the NMEA sentences, the detailed logic can be found at source code here.
In addition, we need to do some small math for calculating the correct latitude and longitude, otherwise you will find your car was driving in the ocean :)
1 2 3 4 5 6 7 8 9 10 11 12 13 14 15 16 17 18
# The latitude is formatted as DDMM.ffff and longitude is DDDMM.ffff where D is the degrees and M is minutes plus the fractional minutes. # So, 1300.8067,N is 13 degrees 00.8067 minutes North and the longitude of 07733.0003,E is read as 77 degrees 33.0003 minutes East. # Converting to degrees you would have to do this: 13 + 00.8067/60 for latitude and 77 + 33.0003/60 for the longitude. # ##NMEA outputs in a human readable DDDMM.mmmm format NOT DECIMAL DEGREES # 3746.03837 # 37 46.03837 # 37 + (46.03837 / 60) # result = 37 + 0.7673062
2.3.1 You cannot do it in the field, do it on an emulator instead
Programming/debugging OBD2 can be difficult - after all I do not want to be programming while driving. Instead of hiring a driver and typing the keyboard on the passenger seat, it is better to use an ODB emulator to emulate all telemetries (and error codes) of the car.
OBD2 Emulator
Lucky I am not alone who has the same problem during OBD development. There are professional and affordable emulators on Aliexpress and Taobao (BTW The price on Taobao is 1/3 as Aliexpress!). The detailed features can be found at here. My respects to the designers of this emulator - you are life savers!
2.3.2 Design for failure and auto healing
Now, with the emulator and python obd lib, it is easy to collect the telemetries of the car.
However, the library does not take care of failures and auto-healing, which we need to do it ourselves, otherwise the code just throw exceptions and stop working.
Thanks to the emulator, it is easy to test all corner scenarios, such as disconnect the ODB and reconnect while “the engine” is still running, in a safe environment. That is impossible to test/debug with real car.
The following code snippet ensures the modules works with different scenarios and self-healing:
Car is powered off
Car is powered on but engine is not started yet
Engine starts
Engine is stopped but car is still powered on
OBD receiver is disconnected (e.g lost bluetooth signal)
1 2 3 4 5 6 7 8 9 10 11 12 13 14 15 16 17 18 19
defgetVehicleTelemtries(deviceId): global connection if(not connection.is_connected()): print("No connecting to the car, reconnecting...") connection = obd.OBD(fast=True) try: # Use library to get readings... if(telemtryDic["RPM"] == 0): print("Cannot read RPM, reconnecting...") connection = obd.OBD(fast=True) returnNone else: return buildJsonPayload(deviceId, telemtryDic)
except Exception as e: print("Error with OBDII, error: " + str(e) + ". Reconnecting...") connection = obd.OBD(fast=True) returnNone
Finally, this module reports the following data per second:
2.3.3 Tips: Considering use ‘Real Time Clock’ or RTC board for your Pi
As Raspberry PI does not have an RTC, the system clock was reset after each power-on. If it has an internet connection, it will fetch the correct date-time from internet, with some delay.
In the current logic, both GPS and OBD modules are using the system clock as the event timestamp. Therefore, if the Pi failed to have internet connection (happened often with mobile hotspot) or sending data before system clock is updated due to delay, the event timestamp will be incorrect.
To overcome this issue, you can install a RTC (Real Time Clock) to the Raspberry Pi, such as this and this.
(Picture: My to-be-tested Raspberry Pi with UPS power expansion board and LoRa/GPS Hat.Hopefully it can use LoRa network connections to replace 4G)
3. Put things together and send to Azure
3.1 Config on the edge
Now we have 2 modules and we have built them into 2 docker images (in variables ${MODULES.OBDModule.arm32v7} and ${MODULES.LocatorModule.arm32v7}). I was hosting them in the dockerhub but it can also be hosted in any private registration.
For now we did not do any computing on the edge but simply forward them to Azure Iot Hub (see here)
Now we 2 module docker images running on the Raspberry Pi and sending data to Azure IoT Edge runtime. The Raspberry Pi has wifi connection to mobile phone 4G hotspot and forwarding the data to Azure IoT Hub in realtime.
This is a quick example of data analytics for the IoT car. In the second part of the series, I will talk more about the data analytics part (including TSI, DataBrick ++) in the cloud.
Continue reading part 2]]>
<p>Previously I wrote a blog about how to <a href="/2020/08/05/How-to-measure-your-Hamster-s-running-with-IoT/" title="measure hamster via IoT wheel">measure hamster via IoT wheel</a>. This reminds me another personal project I did back to the winter of 2018/2019, for measuring car performance. </p>
<img src="/2020/09/15/How-to-build-an-IoT-connected-car-Part-1-On-the-Edge/Thumbnail.png" class="" title="Thumbnail">
How to measure your Hamster's running with wireless IoThttps://feng.lu/2020/08/05/How-to-measure-your-Hamster-s-running-with-IoT/2020-08-05T17:30:43.000Z2021-11-17T19:10:29.631ZWe recently welcomed our new family member Qiuqiu (球球) (a girl Syrian/Golden hamster) home. She seems to enjoy the new environment fairly well, but she is a quiet girl - does not show much activities during the day time.
Of course we understand hamsters are nocturnal animals, which means they are sleeping in day time and become more active at night. But I started wondering how she was doing during the nights, especially how much she ran on the hamster wheel.
Let’s do something about it.
Picture: Qiuqiu with her wheel
1. Hardware
There are many possible ways to track the hamster wheel.
Wired solution, attach wire and switch to the wheel It should work pretty straight forward, but I am not a fan of having wires going through the cage for connecting to the computer. Also Qiuqiu will definitely chew on the wires.
Wireless solution, with computer vision This can be a pretty cool idea: Draw a mark (e.g. a red X) on the wheel, then place a camera (ie. AWS DeepLens) to run some computer vision tasks, for counting the wheel cycle. I like this idea because it requires minimal work on the wheel and no dangerous for the hamster at all. But there also are some challenges such as how to ensure the image quality if there is no light in the room, or the wheel is running too fast to get a stable high quality image.
Wireless solution, with wireless sensor This is what I did - need to attach a sensor on the wheel, but the sensor is so small that can be well protected in a shell. I decided to use zigbee protocol as I already have a smart home system that is well integrated.
Carefully place the sensor on the wheel and the body, make sure when wheel spins, the magnet on the wheel has a small but close enough gap with the sensor body. Used lego part for some adjustments.
1.2.2 Test with realtime sensor reading
Before we continue, I would like to test in action, to make sure the gap is OK. It is possible monitor realtime reading of the sensor, by using the Conbee API. I wrote a simple web app (source code) with javascript and WebSocket, to visualize the realtime reading. The WebSocket API is provided by the Conbee application, see the document here.
Under the hood:
1.2.3 Mount the protective shell
I made a protective shell from a spare plastic box, and mounted on the wheel. Therefore Qiuqiu cannot chew on the sensor. I even made a small hole on the shell to easily use a stick for pressing the sensor reset button, without remove the whole thing.
2. Software
2.1 Manual data export
The BeeCon 2 is a USB-based zigbee gateway that can be attached to a PC or raspberry pi. It talks to the zigbee mesh network and receives signals from sensors. For example, the sensor on the wheel send the following json payload, one for “close” event (magnet and sensor are closed) and another one for “open” event (magnet and sensor are parted). Logically one open-close event pair indicates a finished cycle:
By connecting Conbee gateway with Home Assistant via deCONZ integration, it is fairly easy to export the data as a CSV file. (I plan to build a data pipeline with time series database in the later stage, but for now let’s stay with manual data export.)
Picture: exported csv, with 4 columns
2.2 Data analytics
2.2.1 Data loading and transformation
Now it is time for having some python/jupyter notebook fun. Here we are going to use https://www.kaggle.com/. You can read more comparison of online jupyter notebook hosting at here.
The above code snippet does:
Load CSV file into pandas DataFrame, with needed 2 columns ‘last_changed’ and ‘state’
During loading, parse datetime and also set last_changed as index
Convert fixed string value “on”/“off” in ‘state’ to digital 0/1 in ‘finshedOneRound’ that can be used for plot
2.2.2 Check the raw data and noises
Let’s take a look at the raw data. The first thing I noticed is the “noise” of each cycle. As the door-window close sensor is not designed for tracking a spin, whenever a cycle finished, instead of report simple 2 events: on and off, it actually generates a sequence of events: on-off-on-off-on-off. This is a “noise” that we need to take care of.
it is worth noting that not all cycles follow the same pattern. For example, the 3rd red circle on the screenshot shows an exception: it only has one “on-off” event pair.
2.3 Noise reduction by rolling window calculations
We need a way to “group” the multiple events (“on-off-on-off-on-off”) into one event that indicates a cycle, but we cannot group by a fixed pattern as there are exceptions (as we mentioned above).
After some quick research and testing, without diving into hard-core data science part, I found the rolling window calculation can be a solution for our case.
Lets set the rolling windows to 150 ms - it is “magic number” that works good with the raw data. It purely depends on how fast the hamster runs.
Now you can see that the result of rolling calculation does generate unique markers for each cycle (the green circles), and it works for different patterns in the raw data!
Extract the markers (where rolling result == 1) into a new dataframe df_cycle_log for the next step.
import plotly.graph_objects as go from plotly.subplots import make_subplots # Create figure with secondary y-axis fig = make_subplots(specs=[[{"secondary_y": True}]])
Of course the speed/range can vary from hamster to hamster, and this is data for one evening. The next step is to build a fully automated data pipeline with time series database, create some Grafana dashboards with daily/weekly baseline for long term tracking.
Thanks for the reading.
]]>
<p>We recently welcomed our new family member Qiuqiu (球球) (a girl <a href="https://en.wikipedia.org/wiki/Golden_hamster">Syrian/Golden hamster)</a> home. She seems to enjoy the new environment fairly well, but she is a quiet girl - does not show much activities during the day time.</p>
<p>Of course we understand hamsters are nocturnal animals, which means they are sleeping in day time and become more active at night. But I started wondering how she was doing during the nights, especially how much she ran on the hamster wheel. </p>
<p>Let’s do something about it.</p>
<img src="/2020/08/05/How-to-measure-your-Hamster-s-running-with-IoT/Qiuqiu.jpg" class="" title="This is Qiuqiu with her wheel">
<p>Picture: Qiuqiu with her wheel</p>
Encoding issue when calling API via powershellhttps://feng.lu/2020/06/20/Encoding-issue-when-calling-API-via-powershell/2020-06-20T11:40:00.000Z2021-11-17T19:10:29.409ZRecently we need to fetch a big dataset from an API via powershell, then import to Azure Data Explorer (ADX).
The data.json file looks perfectly fine, but during import to ADX, it reported error “invalid json format”.
Troubleshooting
Using online validation tool such as https://jsonlint.com/, copy & paste the content from data.json. The json objects are valid.
Using local tool jsonlint, reports error. It shows the data.json file has encoding issue.
1 2 3 4 5 6 7 8 9 10 11 12 13 14 15
PS C:\Users\lufeng\Desktop> jsonlint .\data.json Error: Parse error on line 1: ��[ { " _ i d " : { ^ Expecting 'STRING', 'NUMBER', 'NULL', 'TRUE', 'FALSE', '{', '[', got 'undefined' at Object.parseError (C:\Users\lufeng\AppData\Roaming\npm\node_modules\jsonlint\lib\jsonlint.js:55:11) at Object.parse (C:\Users\lufeng\AppData\Roaming\npm\node_modules\jsonlint\lib\jsonlint.js:132:22) at parse (C:\Users\lufeng\AppData\Roaming\npm\node_modules\jsonlint\lib\cli.js:82:14) at main (C:\Users\lufeng\AppData\Roaming\npm\node_modules\jsonlint\lib\cli.js:135:14) at Object.<anonymous> (C:\Users\lufeng\AppData\Roaming\npm\node_modules\jsonlint\lib\cli.js:179:1) at Module._compile (internal/modules/cjs/loader.js:955:30) at Object.Module._extensions..js (internal/modules/cjs/loader.js:991:10) at Module.load (internal/modules/cjs/loader.js:811:32) at Function.Module._load (internal/modules/cjs/loader.js:723:14) at Function.Module.runMain (internal/modules/cjs/loader.js:1043:10)
Solution
Switch to a different powershell command solved the problem
]]>
<p>Recently we need to fetch a big dataset from an API via powershell, then import to Azure Data Explorer (ADX).</p>
<h2 id="Problem"><a hre
How to Decrypt Native App's HTTPS Traffic (and Debug for In-app Browser)https://feng.lu/2020/04/03/How-to-Decrypt-Native-Apps-HTTPS-Traffic-and-Debug-for-In-app-Browser/2020-04-03T18:10:18.000Z2021-11-17T19:10:29.411ZProblem with in-app browser of LinkedIn and Facebook iOS apps
Recently our QA reported an interesting issue regarding the native app and our website: When the webpage was shared on Linkedin iOS App and/or Facebook iOS App, the built-in browsers cannot show it correctly but a blank page.
This issue only happens on some of the iOS apps (see the list below).
Other iOS native apps have no problem.
Safari and Chrome for iOS have no problem.
All Android-based native apps have no problem.
All desktop browsers have no problem.
Native App
Platform
Result
Linkedin
iOS
Not OK
Facebook
iOS
Not OK
Facebook messenger
iOS
Not OK
Slack
iOS
OK
Skype for Business
iOS
OK
Linkedin
Android
OK
Facebook
Android
OK
Facebook messenger
Android
OK
Slack
Android
OK
Skype for Business
Android
OK
Safari
iOS
OK
Chrome for iOS
iOS
OK
Any desktop browser
Win 10
OK
So the problem is about iOS in-app browser in some native apps. But unfortunately these apps (LinkedIn and Facebook) are too important to ignore, so we will have to fix it.
Possible ways for troubleshooting
It is challenging to debug this issue, as it only happens in some of the iOS apps. It can not be reproduced in Safari or other browsers. Possible approaches are:
Reach out to Linkedin or Facebook, ask for what web viewer they’re using in the app.
Search on the internet and hope there is a solution for it.
Let’s become a hacker: Perform a Man-in-the-middle attack between apps and the internet, and to decrypt and manipulate the web traffic of Apps as troubleshooting.
The #1 and #2 are long shots, then I will continue with approach #3. The following diagram shows the architecture.
Let’s decrypt the web traffic of a native app with Fiddler
There some many ways to place a “Man-in-the-middle” between mobile and internet. For example, the famous fiddler can do it.
Follow the instruction to install and configure fiddler on your PC.
Ensure the phone and PC are in the sane network (e.g. same wifi), so your phone can access the PC.
Turn off cellphone data on the phone, to sure traffic from the phone always go through the PC.
From the phone, access http://FiddlerMachineIP:8888 with safari. (Chrome does not support download and install profile)
If your phone can not reach the url on PC, ensure the firewall is turned off on your PC.
Download FiddlerRoot certificate, then install it via Settings -> Profile Downloaded.
On iOS 10 and later, after installing the FiddlerRoot certificate, go to Settings -> General -> About -> Certificate Trust Settings and manually enable full trust for the FiddlerRoot root certificate.
Config proxy on your phone as in the fiddler documentation.
Done, you should be able to see HTTP and HTTPS traffics from the apps now.
The blank page issue is caused by incorrect Content-Security-Policy
Now I have started comparing the HTTPS response for the same URL but from different Apps, and quickly narrowed down the cause to the different values in response header The Content-Security-Policy (CSP).
Content-Security-Policy in the App that have the problem
It is pretty clear that due to the incorrect (much shorter) value of Content-Security-Policy caused the problem.
Some User-Agent caused incorrect Content-Security-Policy (CSP)
Now we need to check what caused the different CSP values. By comparing the requests that these apps were sending in Fiddler, I have quickly identified the request header “User-Agent” is the key.
User-Agent values from Apps that cause wrong CSP
1 2 3 4 5 6 7 8
#Linkedin Mozilla/5.0 (iPhone; CPU iPhone OS 13_3_1 like Mac OS X) AppleWebKit/605.1.15 (KHTML, like Gecko) Mobile/15E148 [LinkedInApp]
#Facebook Mozilla/5.0 (iPhone; CPU iPhone OS 13_3_1 like Mac OS X) AppleWebKit/605.1.15 (KHTML, like Gecko) Mobile/15E148 [FBAN/FBIOS;FBDV/iPhone11,2;FBMD/iPhone;FBSN/iOS;FBSV/13.3.1;FBSS/3;FBID/phone;FBLC/en_US;FBOP/5;FBCR/Telenor]
#Facebook Messenger Mozilla/5.0 (iPhone; CPU iPhone OS 13_3_1 like Mac OS X) AppleWebKit/605.1.15 (KHTML, like Gecko) Mobile/15E148 LightSpeed [FBAN/MessengerLiteForiOS;FBAV/256.0.1.26.113;FBBV/203261359;FBDV/iPhone11,2;FBMD/iPhone;FBSN/iOS;FBSV/13.3.1;FBSS/3;FBCR/;FBID/phone;FBLC/en_NO;FBOP/0]
User-Agent values from Apps that cause correct CSP
1 2 3 4 5
#Slack Mozilla/5.0 (iPhone; CPU iPhone OS 13_3_1 like Mac OS X) AppleWebKit/605.1.15 (KHTML, like Gecko) Version/13.0.5 Mobile/15E148 Safari/604.1
#Skype for Business Mozilla/5.0 (iPhone; CPU iPhone OS 13_3_1 like Mac OS X) AppleWebKit/605.1.15 (KHTML, like Gecko) Version/13.0.5 Mobile/15E148 Safari/604.1
Manipulate web traffic of the apps to simulate different behaviors
Although we cannot change the logic of these apps, we can still easily manipulate the request or response, to simulate the different behaviors.
Head to Fiddler, go to “Filters” table, then you can
Setup the filter to target the manipulation to a specific page
Manipulate requests, such as add/update/remove request headers and body
Manipulate responses, such as headers and body
Some findings are:
“[…]” part in the user-agent does NOT cause the problem, even though they are quite long strings
Missing the “Version/13.0.5” part is causing the problem
Original LinkedIn User-Agent (with issue)
Updated LinkedIn User-Agent (without issue)
Mozilla/5.0 (iPhone; CPU iPhone OS 13_3_1 like Mac OS X) AppleWebKit/605.1.15 (KHTML, like Gecko) Mobile/15E148 [LinkedInApp]
Mozilla/5.0 (iPhone; CPU iPhone OS 13_3_1 like Mac OS X) AppleWebKit/605.1.15 (KHTML, like Gecko) Mobile/15E148 Version/13.0.5 [LinkedInApp]
Root cause and solution
Generally, the web site should return the same CSP for most of the cases. So this is an issue that we should fix on the website.
Now we have fixed this issue locally and once Helmet merged the PR, we are ready to go.
Take away
It is easy to perform a “Man-in-the-middle” like attack, but ONLY IF you have control on the device (e.g. you can install the root certificate).
Once you have a machine between mobile and internet, you can not only monitor the web traffic, but also manipulate both request and response. So if you are interested in how an app is talking to its backend, you have tools to do that.
Advice to normal app user: be careful who have access to your device and try to stay away from the public wifi.
Advice to app developers: always remind yourself that technically it is possible for a hacker to “open your app” and look at which API endpoint your app is talking to, and manipulate the requests. Your app’s private API endpoint will be exposed, take all necessray security measurement on it!
]]>
<h2 id="Problem-with-in-app-browser-of-LinkedIn-and-Facebook-iOS-apps"><a href="#Problem-with-in-app-browser-of-LinkedIn-and-Facebook-iOS-apps" class="headerlink" title="Problem with in-app browser of LinkedIn and Facebook iOS apps"></a>Problem with in-app browser of LinkedIn and Facebook iOS apps</h2><p>Recently our QA reported an interesting issue regarding the native app and our website: When the webpage was shared on Linkedin iOS App and/or Facebook iOS App, the built-in browsers cannot show it correctly but a blank page. </p>
<img src="/2020/04/03/How-to-Decrypt-Native-Apps-HTTPS-Traffic-and-Debug-for-In-app-Browser/problem.gif" class="" title="Problems on Facebook and Linkedin app">
<ul>
<li>This issue only happens on some of the iOS apps (see the list below). </li>
<li>Other iOS native apps have no problem.</li>
<li>Safari and Chrome for iOS have no problem.</li>
<li>All Android-based native apps have no problem.</li>
<li>All desktop browsers have no problem.</li>
</ul>
Jump-start Kubernetes and Istio with Docker Desktop on Windows 10https://feng.lu/2019/10/05/Jump-start-Kubernetes-with-Docker-Desktop-on-Windows-10/2019-10-05T17:57:31.000Z2021-11-17T19:10:29.709ZHere we will setup a single-node Kubernetes cluster on a windows 10 PC (In my case it is a surface 5 with 16GB RAM). If you are new to docker, feel free to check out Jump-start with docker. We are going to setup:
Docker Desktop (or Docker for Windows) is a nice environment for developers on Windows. The community stable version of Docker Desktop is good enough for this jump-start, just make sure the version you installed include Kubernetes 1.14.x or higher. (I am using Docker Desktop Community 2.1.0.3).
Once installed, you can enable Kubernetes in Setting (see detailed info at here)
Then, you can verify it by running “kubectl version“ in powershell (or Command window)
In my case, I got error while connecting to [::1]:8080:
1 2 3 4
PS C:\> kubectl version #Output: Client Version: version.Info{Major:"1", Minor:"14", GitVersion:"v1.14.3", GitCommit:"5e53fd6bc17c0dec8434817e69b04a25d8ae0ff0", GitTreeState:"clean", BuildDate:"2019-06-06T01:44:30Z", GoVersion:"go1.12.5", Compiler:"gc", Platform:"windows/amd64"} Unable to connect to the server: dial tcp [::1]:8080: connectex: No connection could be made because the target machine actively refused it.
This is because I am missing an environment variable “KUBECONFIG“. Set this variable to your user directory such as “C:\Users\YOUR__USER_NAME\.kube\config“.
After adding this and restart your powershell, it should work.
1 2 3 4 5 6 7 8 9 10 11 12 13 14 15 16 17 18 19
PS C:\> Get-Item -Path Env:KUBECONFIG #Output: Name Value ---- ----- KUBECONFIG C:\Users\lufeng\.kube\config
PS C:\> kubectl get namespaces #Output: NAME STATUS AGE default Active 18h docker Active 18h kube-node-lease Active 18h kube-public Active 18h kube-system Active 18h
PS C:\> kubectl apply -f https://raw.githubusercontent.com/kubernetes/dashboard/v1.10.1/src/deploy/recommended/kubernetes-dashboard.yaml #Output: secret/kubernetes-dashboard-certs created serviceaccount/kubernetes-dashboard created role.rbac.authorization.k8s.io/kubernetes-dashboard-minimal created rolebinding.rbac.authorization.k8s.io/kubernetes-dashboard-minimal created deployment.apps/kubernetes-dashboard created service/kubernetes-dashboard created
2.2 Accessing the dashboard
First of all, we need to enable the proxy, so you can access the dashboard from your localhost:
1 2 3
PS C:\> kubectl proxy #Output: Starting to serve on 127.0.0.1:8001
You can find more info from the dashboard github about Access control, but here we will do it simpler (This is for demo purpose, do not apply the same setup in your production environment).
2.2.1 Get token
Get the default token name
1 2 3 4
PS C:\> kubectl get secrets #Output: NAME TYPE DATA AGE default-token-n92hz kubernetes.io/service-account-token 3 18h
Helm is a tool for managing Kubernetes charts. Charts are packages of pre-configured Kubernetes resources. You can read more at https://helm.sh/. According to the installation guide, we are going to:
Ensure configure the environment variable for “HELM_HOME“, such as “C:\Users\USERNAME.kube”. It should be an valid directory in your file system.
1 2 3 4 5
PS C:\> Get-Item -Path Env:HELM_HOME #Output: Name Value ---- ----- HELM_HOME C:\Users\lufeng\.kube
Initialize Helm and install Tiller Once you have Helm ready, you can initialize the local CLI and also install Tiller into your Kubernetes cluster in one step:
#Init helm PS C:\> helm init --history-max 200 #Output: $HELM_HOME has been configured at C:\Users\lufeng\.kube. Tiller (the Helm server-side component) has been installed into your Kubernetes Cluster.
#Verify the triller is up and running (the last row) PS C:\> kubectl get pods --namespace kube-system #Output: NAME READY STATUS RESTARTS AGE coredns-fb8b8dccf-b5lq5 1/1 Running 0 19h coredns-fb8b8dccf-t5kdf 1/1 Running 0 19h etcd-docker-desktop 1/1 Running 0 19h kube-apiserver-docker-desktop 1/1 Running 0 19h kube-controller-manager-docker-desktop 1/1 Running 0 19h kube-proxy-bj2x4 1/1 Running 0 19h kube-scheduler-docker-desktop 1/1 Running 0 19h kubernetes-dashboard-5f7b999d65-vqdq6 1/1 Running 0 19h tiller-deploy-5454fb964d-8tp5t 1/1 Running 0 76s
4. Installing Istio
Istio is a microservice-mesh management framework, that provides traffic management, policy enforcement, and telemetry collection. We are going to:
Install Istio (and addons such as Kiali) via Helm (doc)
PS C:\> helm repo add istio.io https://storage.googleapis.com/istio-release/releases/1.3.1/charts/ #Output: "istio.io" has been added to your repositories
#Use Helm’s Tiller pod to manage Istio release (option 2), as we installed Tiller in previous step. PS C:\> cd istio
#1. Make sure you have a service account with the cluster-admin role defined for Tiller. If not already defined, create one using following command PS C:\istio> kubectl apply -f install/kubernetes/helm/helm-service-account.yaml #Output: serviceaccount/tiller created clusterrolebinding.rbac.authorization.k8s.io/tiller created
#2. Config Tiller on your cluster with the service account: PS C:\istio> helm init --upgrade --service-account tiller #Output: $HELM_HOME has been configured at C:\Users\lufeng\.kube. Tiller (the Helm server-side component) has been upgraded to the current version.
#3. Install the istio-init chart to bootstrap all the Istio’s CRDs: PS C:\istio> helm install install/kubernetes/helm/istio-init --name istio-init --namespace istio-system #Output: NAME: istio-init LAST DEPLOYED: Fri Oct 4 11:36:15 2019 NAMESPACE: istio-system STATUS: DEPLOYED
RESOURCES: ==> v1/ClusterRole NAME AGE istio-init-istio-system 0s
==> v1/ClusterRoleBinding NAME AGE istio-init-admin-role-binding-istio-system 0s
==> v1/ConfigMap NAME DATA AGE istio-crd-10 1 0s istio-crd-11 1 0s istio-crd-12 1 0s
==> v1/Job NAME COMPLETIONS DURATION AGE istio-init-crd-10-1.3.1 0/1 0s istio-init-crd-11-1.3.1 0/1 0s 0s istio-init-crd-12-1.3.1 0/1 0s 0s
==> v1/Pod(related) NAME READY STATUS RESTARTS AGE istio-init-crd-11-1.3.1-qz4fh 0/1 ContainerCreating 0 0s istio-init-crd-12-1.3.1-6rk5w 0/1 ContainerCreating 0 0s
==> v1/ServiceAccount NAME SECRETS AGE istio-init-service-account 1 0s
Then select a configuration profile. We go with “demo“ as it include some nice addons such as Kiali.
As we installed the Demo configuration profile of Istio, Kiali was also installed. Kiali is an observability console for Istio with service mesh configuration capabilities. (Read more at https://istio.io/docs/tasks/telemetry/kiali/ also)
To open Kiali UI, pls run
1 2 3 4
PS C:\istio> kubectl -n istio-system port-forward $(kubectl -n istio-system get pod -l app=kiali -o jsonpath='{.items[0].metadata.name}') 20001:20001 #Output: Forwarding from 127.0.0.1:20001 -> 20001 Forwarding from [::1]:20001 -> 20001
Again, it ask for login. As in this case, Kiali was installed as a part of the Demo configuration profile, you can use default user name “admin“ and password “admin“ to login.
#2. Deployment PS C:\istio> kubectl apply -f samples/bookinfo/platform/kube/bookinfo.yaml #Output: service/details created serviceaccount/bookinfo-details created deployment.apps/details-v1 created service/ratings created serviceaccount/bookinfo-ratings created deployment.apps/ratings-v1 created service/reviews created serviceaccount/bookinfo-reviews created deployment.apps/reviews-v1 created deployment.apps/reviews-v2 created deployment.apps/reviews-v3 created service/productpage created serviceaccount/bookinfo-productpage created deployment.apps/productpage-v1 created
#3. Verify services and pods PS C:\istio> kubectl get services #Output: NAME TYPE CLUSTER-IP EXTERNAL-IP PORT(S) AGE details ClusterIP 10.110.165.24 <none> 9080/TCP 33s kubernetes ClusterIP 10.96.0.1 <none> 443/TCP 6h50m productpage ClusterIP 10.97.123.119 <none> 9080/TCP 32s ratings ClusterIP 10.111.216.40 <none> 9080/TCP 33s reviews ClusterIP 10.109.244.28 <none> 9080/TCP 33s
#4. Verify by calling the application PS C:\istio> kubectl exec -it $(kubectl get pod -l app=ratings -o jsonpath='{.items[0].metadata.name}') -c ratings -- curl productpage:9080/productpage | select-string -pattern "<title>" #Output: <title>Simple Bookstore App</title>
Establish gateway for the bookinfo app
1 2 3 4 5 6 7 8 9 10 11
#1. Apply gateway PS C:\istio> kubectl apply -f samples/bookinfo/networking/bookinfo-gateway.yaml #Output: gateway.networking.istio.io/bookinfo-gateway created virtualservice.networking.istio.io/bookinfo created
#2. Verify the gateway PS C:\istio> kubectl get gateway #Output: NAME AGE bookinfo-gateway 38s
Confirm the app is accessible from outside the cluster Go to http://localhost/productpage to verify you can open the page. You can refresh the page several times for generating telemtries.
Kiali Visualization Assuming the 20001 port forwarding is still running, then you can visualize the service relationship in Kiali http://localhost:20001/
# 1. Deployment PS C:\> kubectl run grafana-test --generator=run-pod/v1 --image=grafana/grafana --port=3000 #Output: pod/grafana-test created
# 2. Check the name of the grafana pod. Note it is sitting in "default" namespace PS C:\> kubectl -n default get pod #Output: NAME READY STATUS RESTARTS AGE details-v1-c5b5f496d-sgr6w 2/2 Running 0 29h grafana-test 2/2 Running 0 97s kubernetes-bootcamp-b94cb9bff-vsprh 2/2 Running 0 3h6m productpage-v1-c7765c886-6cpr9 2/2 Running 0 29h ratings-v1-f745cf57b-87m7q 2/2 Running 0 29h reviews-v1-75b979578c-vmzn2 2/2 Running 0 29h reviews-v2-597bf96c8f-plml7 2/2 Running 0 29h reviews-v3-54c6c64795-x67ss 2/2 Running 0 29h
# 4. Enable port forwarding. # In case you wanna use select as the pod name contains random string, # Use "kubectl -n default port-forward $(kubectl -n default get pod -l run=grafana-test -o jsonpath='{.items[0].metadata.name}') 3000:3000" PS C:\> kubectl -n default port-forward grafana-test 3000:3000 #Output: Forwarding from 127.0.0.1:3000 -> 3000 Forwarding from [::1]:3000 -> 3000
Now, you should have a kubernetes environment up and running, together with Istio and Kiali enabled. It can be used as your sandbox, for developing and testing your applications in Kubernetes. With Istio and Kiali, you can also play with service mesh. Everything is running locally in “one box”, so you do not need to worry about any cloud running cost.
Have fun.
]]>
<p>Here we will setup a single-node Kubernetes cluster on a windows 10 PC (In my case it is a surface 5 with 16GB RAM). If you are new to docker, feel free to check out <a href="/2017/03/31/Jump-start-ASP-Net-Core-with-Docker/">Jump-start with docker</a>.<br>We are going to setup:</p>
<ul>
<li>A single-node Kubernetes cluster</li>
<li><a href="https://github.com/kubernetes/dashboard">Kubernetes dashboard</a></li>
<li>Helm</li>
<li>Isito (service mesh, including Kiali)</li>
<li>Deployment samples</li>
</ul>
<img src="/2019/10/05/Jump-start-Kubernetes-with-Docker-Desktop-on-Windows-10/Title%20picture.png" class="">
Customize social sharing on Linkedin via APIhttps://feng.lu/2019/02/06/Customize-social-sharing-on-Linkedin-via-API/2019-02-06T19:34:51.000Z2021-11-17T19:10:29.341Z(edited 10.06.2020: Updated how to get User ID as LinkedIn upgraded their endpoints)
Problem:
Nowadays it is pretty common to share articles on social media such as Facebook and Linkedin. Thanks to the widely implemented Open Graph protocol, sharing is no long just a dry url, but with enrich text and thumbnails.
However, there are still some web pages that do not have Open Graph implemented, which significantly reduces the readers’ willingness for clicking it.
In addition, even you introduced the Open Graph tags as a hotfix, some times you will have wait for approximately 7 days for linkedin crawler to refresh the preview caching, as mentioned in linkedin documentation:
The first time that LinkedIn’s crawlers visit a webpage when asked to share content via a URL, the data it finds (Open Graph values or our own analysis) will be cached for a period of approximately 7 days. This means that if you subsequently change the article’s description, upload a new image, fix a typo in the title, etc., you will not see the change represented during any subsequent attempts to share the page until the cache has expired and the crawler is forced to revisit the page to retrieve fresh content.
Some solutions are here and here, but they are more like a workaround.
Solution:
We can overcome this issue by using linkedin API, which provide huge flexibility for customizing the sharing experiences.
Scope: “r_emailaddress r_liteprofile w_member_social” (need “w_member_social” as we need to post)
Login to generate token
3. Get user id from linkedin
In order to post articles in LinkedIn via API, we need to provide the user id. Make a GET request to API https://api.linkedin.com/v2/me (see document), make sure the token from step 2 is included. The result is something like below:
{ "content": { "contentEntities": [ { "entityLocation": "http://feng.lu/archives/", "thumbnails": [ { "resolvedUrl": "http://feng.lu/2019/02/06/Customize-social-sharing-on-Linkedin-via-API/archives.jpg" } ] } ], "title": "Article archives of feng.lu" }, "distribution": { "linkedInDistributionTarget": {} }, "owner": "urn:li:person:MY_LINKEDIN_ID", "text": { "text": "Checkout my blog archives! Hopefully you will find it useful. :)" } }
Checkout the result:
Conclusion:
By using LinkedIn API, we can easily customize the sharing experience with your professional networks. It does not only overcome the challenges such as missing Open Graph implementation, but also can improve the social media campaign experience and better integration with CMS.
]]>
<p>(edited 10.06.2020: Updated how to get User ID as LinkedIn upgraded their endpoints)</p>
<h1 id="Problem"><a href="#Problem" class="headerlink" title="Problem:"></a>Problem:</h1><p>Nowadays it is pretty common to share articles on social media such as Facebook and Linkedin. Thanks to the widely implemented <a href="http://ogp.me/">Open Graph</a> protocol, sharing is no long just a dry url, but with enrich text and thumbnails.</p>
<p>However, there are still some web pages that do not have Open Graph implemented, which significantly reduces the readers’ willingness for clicking it. </p>
<img src="/2019/02/06/Customize-social-sharing-on-Linkedin-via-API/With%20vs%20without%20thumbnails.png" class="" title="With vs without thumbnails">
<p>In addition, even you introduced the Open Graph tags as a hotfix, some times you will have wait for approximately 7 days for linkedin crawler to refresh the preview caching, as mentioned in <a href="https://developer.linkedin.com/docs/share-on-linkedin">linkedin documentation</a>: </p>
<blockquote>
<p><em>The first time that LinkedIn’s crawlers visit a webpage when asked to share content via a URL, the data it finds (Open Graph values or our own analysis) will be cached for a period of approximately 7 days.</em><br><em>This means that if you subsequently change the article’s description, upload a new image, fix a typo in the title, etc., you will not see the change represented during any subsequent attempts to share the page until the cache has expired and the crawler is forced to revisit the page to retrieve fresh content.</em></p>
</blockquote>
<p>Some solutions are <a href="https://support.strikingly.com/hc/en-us/articles/214364928-LinkedIn-or-Facebook-Share-Image-Not-Updating">here</a> and <a href="https://www.linkedin.com/pulse/how-clear-linkedin-link-preview-cache-ananda-kannan-p/">here</a>, but they are more like a workaround. </p>
<h1 id="Solution"><a href="#Solution" class="headerlink" title="Solution:"></a>Solution:</h1><p>We can overcome this issue by using linkedin API, which provide huge flexibility for customizing the sharing experiences. </p>
Data Integrity and Lineage by using DLT, Part 3https://feng.lu/2019/01/03/Data-Integrity-and-Lineage-by-using-DLT-Part-3/2019-01-03T10:08:30.000Z2021-11-17T19:10:29.387ZOther articles in this series:
In the second part of this series, we have went though both the detailed technical design that is based on IOTA. Some quick recap are:
Use MAM protocol for interacting with IOTA Tangle.
Defined the core data schema (4 mandatory fields: “dataPackageId”, “wayOfProof” , “valueOfProof” and “inputs”).
Although the core data schema is quite easy to implement, companies and developers might meet some challenges to get started, such as:
Developers need to build the knowledge of IOTA and MAM protocol.
Need to build user interface for data lineage visualization.
Companies most likely need to setup and maintain their dedicated infrastructure (Web server that runs IOTA server code, database, resource to perform Proof-of-Work, connection to neighbor nodes in IOTA network, etc), as public nodes from community are not stable.
Data Lineage Service - an open source application to get you started
We want to address above challenges, and help everyone to gain benefits of data integrity and lineage. Therefore, we have built “Data Lineage Service“ application. Developers and companies can apply this technology without deep understanding of IOTA and MAM protocol. It can be used either as a standalone application, or a microservice that integrates with existing systems.
The key functions are:
Wrapped IOTA MAM protocol to well-known HTTP(s) protocol as standard Restful API, with swagger definition. Developers do not need to worry about MAM protocol and it technical details, but focus on the normal data pipeline.
Reusable web interface for lineage visualization.
User-friendly interface for submitting data integrity and lineage information to DLT.
Built-in functionalities for addressing common issues such as caching and monitoring.
Also, for one who simply wanna try it out in the live environment, we are hosting this service that connects to the live DLT environment (IOTA tangle mainnet).
As a live environment, it allows anyone to:
Submit and receive integrity/lineage information with the live IOTA tangle mainnet, without maintain his/her own infrastructure.
Outsource Proof-of-work (PoW) from clients to the service. Our host environment is taking care of the PoW on the server side. It helps IoT devices with low computing power (such as Raspberry PI) to submit information to DLT without consuming local resources. This also helps to improve the submission throughput (Number of submission per second).
All functions can be done via either web browser or restful APIs.
Zero cost for testing and building Proof-of-Concept applications with real-world DLT.
The live demo environment can be found at https://datalineage-viewer.azurewebsites.net This live environment is backed by IOTA public network (public IOTA nodes). Feel free to use it (either GUI or API swagger) to store your integrity and lineage data into IOTA mainnet, as well as visualize the existing data.
Real World Demo: Real-time data integrity on IoT device
By using this service, an IoT device can ensure the integrity of its IoT data stream. As a demo, I have a raspberry pi with sense hat that is reporting temperature as well as saving the integrity information to DLT. The integrity information can be read at here from DLT.
Therefore, the data consumer of this temperature sensor can be confident that:
the temperature report (and the report timestamp) is not tampered
it is indeed from this raspberry pi
this data integrity information can be included into the downstream data lineage
From day 1, the performance of DLT is a known issue. By expanding this technology into the IoT and real-time data exchanging world, the performance can be a blocking issue. This is also the reason that we started look into IOTA in the beginning, hope its performance can meet the need.
We have conducted the performance testing in 3 iterations:
Performance of reading is OK (0.5 second per read), as far as you have a stable IOTA node (either self-host or from a provider)
Outsource the PoW to dedicated service providers such as powsrv.io can significantly improve the performance of writing, but the best result allows us to do about 15 transactions per minute.
Next step
In veracity we are researching and building Data Integrity and Lineage as a Service (DILAAS) to bring down the barriers for both data providers and data consumers. DILAAS offers:
A cloud service for managing and exchanging data integrity and lineage information between parties.
Standard HTTP(s) API, without building competence of backend DLT, such as MAM programming. It helps to reduce the development cost and boost the onboard progress.
Visualization of data integrity and lineage information.
Managed infrastructure that offers stable IOTA network accessibility.
Seed/Identity management, for properly managing the seeds/identifies in the secure environment.
]]>
<p><strong>Other articles in this series:</strong></p>
<ul>
<li><a href="http://feng.lu/2018/09/25/Data-Integrity-and-Lineage-by-using-DLT-Part-1/">Part 1</a></li>
<li><a href="http://feng.lu/2018/10/03/Data-Integrity-and-Lineage-by-using-DLT-Part-2/">Part 2</a> </li>
<li>Part 3 (this article)</li>
</ul>
<h1 id="Recap"><a href="#Recap" class="headerlink" title="Recap"></a>Recap</h1><p>In the second part of this series, we have went though both the detailed technical design that is based on IOTA. Some quick recap are:</p>
<ol>
<li>Use MAM protocol for interacting with IOTA Tangle.</li>
<li>Defined the core data schema (4 mandatory fields: “dataPackageId”, “wayOfProof” , “valueOfProof” and “inputs”). </li>
</ol>
<p>Although the core data schema is quite easy to implement, companies and developers might meet some challenges to get started, such as:</p>
<ol>
<li>Developers need to build the knowledge of IOTA and MAM protocol.</li>
<li>Need to build user interface for data lineage visualization.</li>
<li>Companies most likely need to setup and maintain their dedicated infrastructure (Web server that runs IOTA server code, database, resource to perform Proof-of-Work, connection to neighbor nodes in IOTA network, etc), as public nodes from community are not stable. </li>
</ol>
<h1 id="Data-Lineage-Service-an-open-source-application-to-get-you-started"><a href="#Data-Lineage-Service-an-open-source-application-to-get-you-started" class="headerlink" title="Data Lineage Service - an open source application to get you started"></a>Data Lineage Service - an open source application to get you started</h1><p>We want to address above challenges, and help everyone to gain benefits of data integrity and lineage. Therefore, we have built “<strong>Data Lineage Service</strong>“ application. Developers and companies can apply this technology without deep understanding of IOTA and MAM protocol. It can be used either as a standalone application, or a microservice that integrates with existing systems.</p>
<p>The key functions are:</p>
<ul>
<li>Wrapped IOTA MAM protocol to well-known HTTP(s) protocol as standard Restful API, with swagger definition. Developers do not need to worry about MAM protocol and it technical details, but focus on the normal data pipeline.</li>
<li>Reusable web interface for lineage visualization.</li>
<li>User-friendly interface for submitting data integrity and lineage information to DLT.</li>
<li>Built-in functionalities for addressing common issues such as caching and monitoring.</li>
<li>It is <a href="https://github.com/veracity/data-lineage-service">open-sourced on github</a> with MIT license.</li>
</ul>
Data Integrity and Lineage by using DLT, Part 2https://feng.lu/2018/10/03/Data-Integrity-and-Lineage-by-using-DLT-Part-2/2018-10-03T18:14:40.000Z2021-11-17T19:10:29.374ZOther articles in this series:
In my previous article, we discussed different approaches for solving the data integrity and lineage challenges, and concluded that the “Hashing with DLT“ solution is the direction we will move forward. In this article, we will have deep dive into it. Please not that Veracity’s work on data integrity and data lineage is testing many technologies in parallel. We utilise and test proven centralized technologies as well as new distributed ledger technologies like Tangle and Blockchain. This article series uses the IOTA Tangle as the distributed ledger technology. The use cases described can be solved with other technologies. This article does not necessarily reflect the technologies used in Veracity production environments.
Which DLT to select?
As Veracity is part of an Open Industry Ecosystem we have focused our data integrity and data lineage work using public DLT and open sourced technologies. We believe that to succeed with providing transparency from the user to the origin of data many technology vendors must collaborate around common standards and technologies. The organizational setup and philosophies for some of the public distributed ledgers provides the right environment to learn and develop fast with an adaptive ecosystem.
There are many public DLT platforms nowadays, but not all of them (such as Bitcoin and Ethereum) are suitable for Big Data or IoT scenarios, such as:
We are tracking logical data entities (bits, files or data streams) instead of physical entities (coal, car parts or packages).
The granularity of data has much more detailed scale in IoT and the Big Data world. One example is, tracking every single piece of coal from a carrier ship sounds crazy, but tracking every data signal from thousands of sensors from the very same ship is quite common.
We need to use DLT to handle large volume of transactions within a short time period (e.g. send 1000 data points from one device to another device per minute)
We need to use DLT to store large amount of data (e.g. data integrity information of thousands of sensors)
High transaction fees will weaken the business case.
IOTA - the selected DTL for exploring
We have been watching closely at the technology evolution of distributed ledgers and exploring different possibilities. Currently we are exploring IOTA, which is a new type of DLT that foundationally different from other blockchain-based technologies. The high-level comparison can be found at IOTA FAQs, question “How is IOTA different from Blockchain?” We decide to test our solution on top of IOTA, due to the following key features that IOTA offers:
Promise of higher performance and scalability: Thanks to tangle data structure.
Zero Transaction Fee: Machine to Machine micropayments. This way machines can pay each other for certain services and resources.
This is not an article of introducing IOTA, but you can learn more from https://www.iota.org
MAM protocol from IOTA
In addition, IOTA provides a protocol named Masked Authenticated Messaging (MAM) that easily fit into our solution. MAM provides an abstract data structure layer (channels) on top of regular transactions. In our solution, all read and write data into DLT (tangle) is around MAM channels. Check the article appendix for more resources of MAM.
One person or application creates a private seed. The seed shall be considered as a private key, and not be shared with others.
One seed can create one unique MAM channel in IOTA tangle that can store messages.
Messages contain data such as json object.
The private seed ensures that only the seed owner is authorized to write messages in the channel. Therefore the origin of the messages is trusted by others.
Once the message was written into channel, the message is replicated and stored in all nodes in DLT. It means the message is immutable.
Once you know a MAM address in the channel, you can go through all addresses (and fetch their messages) that follows the known address, such as root address -> address 1 -> address 2 -> address 3 -> address N…
The message can be fetched from channels by using the MAM address.
Therefore, Alice can publish the hash values like the following diagram In above case, Alice creates one channel with her private seed. Then she sends messages into this channel, one address has one message.
Generates a random seed and create a public MAM channel
Accepts inputs from keyboard and send it to tangle as json format
Once the message was sent do tangle, anyone can query the tangle and read it from the public channel. But none can change it since it is immutable. You can read the MAM message by using a good tool https://thetangle.org/mam.
Design principles and conceptual entities
First, let’s agree some design principles and conceptual entities
1. Self-service verification process
The verification process of both data integrity and data lineage should be self-service. It means that all verification information should be available to public. Data provider should not be bothered by this process. (Technically it is possible to have permission control of the verification process, by using private or restricted MAM channels, it means that data provider has to response to the ad-hoc verification requests)
2. Data lineage verification is an add-on on the side of the main data-flow
It means that data lineage will not impact the existing data flow, nor become a bottleneck.
3. Conceptual entities
3.1 Data Source
A sensor, person or application that generates data package(s)
Has 0 or more inputs (upstream data source)
Has 1 or more outputs (downstream data source)
A company can have more than one data sources
3.2 Data Package
An atomic unit in data flow from one data source to another data source. For example:
A data point (23 degree at 10:30am), or
A file (json, xml)
Files (1.json, 2.json…10.json…)
Data rows in a database (row #1 to row #10 in table “employee”)
3.3 Data Package Id
The unique ID of a data package in the scope of a data source. A typical data package ID is a number, a GUID or a time-stamp.
3.4 Data Stream
Data stream is data package series from the same data source. It contains more than one packages and their IDs.
Deep dive #1: Data integrity
Goal: Data consumers can verify the integrity of data packages from a data source.
Overview of data integrity workflow
The high level overview of data integrity workflow is as following:
Step 1. Data source announces its MAM channel root address, for publishing integrity information
Data source creates a MAM public channel by using its private seed, then share the root address of this channel with public. It can be done, for instance, via data source’s web site.
Side Note: Why publish only root address, not all individual addresses per each package
The data source can, of course, publish all individual addresses for all messages, but it will be too many. As long as consumers have the channel root address, they can go through all addresses from the root, to find the specific address/message to verify. See step 5.
Step 2. Decide your integrity information content
In order to allow the consumer to verify the integrity, data source need to provide enough information to make it possible. Therefore, you need to decide what information should be stored in the tangle as json object.
Mandatory fields
All object must have the following core fields. All of them are mandatory.
| Field | Description | Example | |—|—|—| | datapackageId | The package ID is used for querying the data lineage info from the channel. Data source decides the ID format, such as integer or GUID. Different channels can have the same package ID. | “123456” | | wayofProof | Information about how to verify the integrity based on valueOfProof. For example, it explains the used hash algorithms (SHA1 or SHA2 or others), or it simply copied the data package content into field valueOfProof. | “SHA256(packageId, data-content)” | | valueOfProof | The value of the proof, such as hash value, or the copy of the data content in clear text. | (hash value or data itself) |
Example An application (aka data source) generates big csv files and pass to the downstream (aka data consumer). All csv files have a unique file name. The application decides to hash the file content together with the file name. The hash function can be one of the Secure Hash Algorithms, such as SHA-512/256.
Therefore, for file “file201.csv”, the application computed the hash based on SHA512(“201”, filecontent.string()), which is “7EC8E…AAFAA”
Use hash for reducing calls to tangle The hash is also useful if you want to reduce the data sent to tangle. For example, a data source is generating a small file per second. However, pushing data to tangle in every second can be a performance bottleneck. If the data source pack all files of every 10 minutes into one, assign an ID and compute the hash value of this data trunk, it can still publish integrity data into tangle but with much lower frequency.
Extend it with optional fields
In addition to the above mandatory fields, you can extend the json object by adding more additional fields for fitting your logic.
For example, you can add a field “location” for storing the application name, and “sensorType” of application owner type. These fields will be tightly coupled with these core fields, and stored in the tangle.
Note “timestamp” is not a mandatory field, as all transactions in Tangle already has a system timestamp that shows when the data was submitted to the tangle. You can add a “package-received-timestamp” field that shows when the original data package was collected.
Step 3. Data source send data integrity information to the channel
Data source sends above json object to the MAM channel (IOTA tangle). The json object will be stored in a MAM address inside of the channel. This can be done by using the demo code shown above.
— At this point, data source completes all needed tasks—-
Step 4. Data consumer obtains the root address of the MAM channel from the data source
Data consumer goes to the website from step 1 to get the root address of the MAM channel that belongs to the data source.
Step 5. Data consumer obtains the wayOfProof and valueOfProof for a specific package
Data consumer goes through the MAM channel, address by address, to find the json object for the specific package, by using packageID. Then it obtains the wayOfProof and valueOfProof for that package.
// get root address of the channel, from data source website currentAddress = channel-root-address-got-from-data-source-website
// to find message for package #201 targetPackageId = 201
// start from the root address, go through all messages in this channel, to find the target message while(currentAddress != null) { var currentInfo = MAM.GetInfoFromAddress(currentAddress) if(currentInfo.PackageId == targetPackageId) { // found the verification info for the target package, return return currentInfo } else { //the current address is not for the target package, go to next address currentAddress = currentAddress.nextAddress } }
//check currentInfo.wayOfProof and currentInfo.valueOfProof
Step 6. Data consumer prepare for verification
Data consumer read the “wayOfProof” to understand how to check the “valueOfProof” field. For example, compute the hash by using the same hash function “SHA512(201, filecontent.string())” for package 201.
Step 7. Data consumer to verify the integrity
Data consumer compares the hash values from the MAM channel and the local compute process.
If hash value matches, then integrity is OK, accept the package.
If hash value does NOT match, then integrity is NOT OK, reject the package.
Deep dive #2: Data Lineage
A case study
Let’s look at a real life case:
You as an American tourist was having an vacation in Norway. You were driving a car and had a great experience of the fjords. Unfortunately you had a small accident outside of a gas station, and the car windshield was damaged (but lucky, no one has been injured). The local police station was informed and issued a form (in Norwegian!) about this accident.
Now you would like to report this to your insurance company.
Most likely the insurance company would like to know if they can trust the damage report. You can of course explain that the data flow is:
The police station in Norway issued a statement in Norwegian “2018 20. februar 13:00: En liten bilulykke utenfor Esso bensinstasjon på Billingstadsletta 9, 1396 Billingstad. Bilskade: 5000 NOK.”
Since the US based insurance company only accept documents in English, a translation provider helped to translate this statement from Norwegian to English: “2018 Feb 20th, 13:00PM: A small car accident outside of Esso gas station at Billingstadsletta 9, 1396 Billingstad.Car damage: 5000 NOK. “
The next step is to convert the currency 5000 NOK to US Dollar, according to the currency rate of 2018 Feb 20th, as well as provide a map for describing the location of the accident. Therefore a currency converter and a geolocation service provider were involved for providing data.
If we can store and verify this flow (data lineage of the report), it will:
Provide full traceability of the end-to-end process
Save huge cost from insurance company by reducing the time-consuming manual verification process
Immutable histories of all inputs of the report. It also helps to identify responsibility of any false input.
Solution Design
On the top of the data integrity layer that we discussed above, it is easy to extend the format to build the data lineage layer.
Now we extend the format to include an optional field “inputs“, which is an array of MAM addresses. These addresses represent the data integrity information of all inputs of the current data package. A MAM address is a global unique identifier in Tangle, regardless of which channel it belongs to.
Depends on if you have any input, “inputs“ field is optional. You can ignore this field, or have this field, but the value is null.
The illustration is as below:
Then, for above insurance report case, by using the additional inputs field, it is easy to establish the follow data lineage flow:
It means that
The insurance company can verify that the report#33 is indeed from the report generator and it was not tampered.
By following the inputs fields, the insurance company can also find all upstream data and data origin in report#33, and verify the integrity of them as well.
It also helps, for example, if there is a mistake of the currency convert from NOK to USD, it is the currency converter, not the report generator (customer), that holds the responsibility.
FAQ
Q1: Can I use IOTA and MAM protocol without IOTA token? A1: Yes. Technically all MAM messages are 0(zero) value transactions. You can create unlimited MAM messages without any IOTA token.
Q2: Can I use IOTA and MAM protocol without hosting an IOTA node? A1: Yes. You can use public hosted nodes on mainnet. For example, check https://thetangle.org/nodes or google “iota public nodes”. However, for production-ready solutions, having a managed node is recommended, which can offer you, for example, capacity of permanode, see Q3.
Q3: What are Public nodes and Permanode? Which one should I use? A3: Some explanation can be found at here, for example. The short answer is, if you need to keep the historical MAM messages away from IOTA snapshots, go with permanode. Veracity is planning to host permanode(s) for the platform and its partners/customers.
Q4: Is it free to create a private seed and send messages to MAM channels? A4: Yes, you can simply create a seed (a string) locally and store data into MAM channel. Feel free to generate seeds for your sensors/applications.
Q5: I do not want to use public MAM channels that anyone can take a look at, even if I know the messages only contain hash values. How can I protect the channels? A5: MAM channel supports 3 access levels: public, private and restricted. In our solution, in order to make the verification as a self-service, we decided to use public channels. But it is possible to switch to private or restricted channels, and grant access to the selected data consumers to the channel.
Q6: I have an application that is sending out data to consumers. Do I need to do anything if a new consumer starts using my data and build the lineage on top of it? A6: No. As a data source sitting in the upstream, you do not need to do anything for downstream consumers.
Q7: I am a data consumer. What information do I need to create the whole data lineage covering all inputs in different levels? For example, if the data flow is Alice->Bob->Carol->myself, do I need to know the MAM root address of Alice, Bob and Carol? A7: No, you only need MAM root of Carol. As far as you follow the input fields recursively,you can check integrity and lineage of Bob (Carol’s upstream) and Alice (Bob’s upstream). In above insurance case, the insurance company can also follow the inputs fields to check, for example, the translator’s message and the Norwegian police station’s message.
Q8: This solution sounds great, but it can take some efforts to build it, such as build the UX for data lineage visualization, API for read/write MAM messages, manage seeds properly, etc. Is there anything we can reuse? A8: I am glad that you asked. In veracity we are building Data Integrity and Lineage as a Service (DILAAS) to bring down the barriers for both data providers and data consumers. DILAAS offers:
A cloud service for managing and exchanging data integrity and lineage information between parties.
Standard HTTP API, without building competence of backend DLT, such as MAM programming. It helps to reduce the development cost and boost the onboard progress.
Seed/Identity management, for properly managing the seeds/identifies in the secure environment.
Visualization of data integrity and lineage information.
Summary
In this article, we discussed the detailed design of verification data schema, such as these crucial fields: “datapackageId”, “wayofProof” , “valueOfProof” and “inputs”. We also implemented the solution on the selected DLT: IOTA and its MAM protocol. In next article of this series, we will put this solution into actions, and have closer look at some components of the DILAAS.
Appendix
Masked Authenticated Messaging (MAM) was introduced by IOTA in Nov 2017. The high level description can be found here. In addition, some deep dive information of Tangle transaction and MAM can be found at:
]]>
<p><strong>Other articles in this series:</strong></p>
<ul>
<li><a href="http://feng.lu/2018/09/25/Data-Integrity-and-Lineage-by-using-DLT-Part-1/">Part 1</a></li>
<li>Part 2 (this article)</li>
<li><a href="http://feng.lu/2019/01/03/Data-Integrity-and-Lineage-by-using-DLT-Part-3/">Part 3</a></li>
</ul>
<p>In my previous article, we discussed different approaches for solving the data integrity and lineage challenges, and concluded that the “<strong>Hashing with DLT</strong>“ solution is the direction we will move forward. In this article, we will have deep dive into it. Please not that Veracity’s work on data integrity and data lineage is testing many technologies in parallel. We utilise and test proven centralized technologies as well as new distributed ledger technologies like Tangle and Blockchain. This article series uses the IOTA Tangle as the distributed ledger technology. The use cases described can be solved with other technologies. This article does not necessarily reflect the technologies used in Veracity production environments.</p>
<h1 id="Which-DLT-to-select"><a href="#Which-DLT-to-select" class="headerlink" title="Which DLT to select?"></a>Which DLT to select?</h1><p>As Veracity is part of an Open Industry Ecosystem we have focused our data integrity and data lineage work using public DLT and open sourced technologies. We believe that to succeed with providing transparency from the user to the origin of data many technology vendors must collaborate around common standards and technologies. The organizational setup and philosophies for some of the public distributed ledgers provides the right environment to learn and develop fast with an adaptive ecosystem. </p>
<img src="/2018/10/03/Data-Integrity-and-Lineage-by-using-DLT-Part-2/title.jpg" class="">
Data Integrity and Lineage by using DLT, Part 1https://feng.lu/2018/09/25/Data-Integrity-and-Lineage-by-using-DLT-Part-1/2018-09-25T18:33:49.000Z2021-11-17T19:10:29.357ZOther articles in this series:
With the proliferation of data – collecting and storing it, sharing it, mining it for gains – a basic question goes unanswered: is this data even good? The quality of data is of utmost concern because you can’t do meaningful analysis on data which you can’t trust. Here in Veracity, we are trying to address this is very concern. This is a 3 part series, going all the way from concept to a working implementation using DLT (Distributed Ledger Technology).
Side note, Veracity is designed to help companies unlock, qualify, combine and prepare data for analytics and benchmarking. It helps data providers to easily onboard data to the platform, and enable data consumers to access and mine value. The data can be from various sources, such as sensors and edge devices, production systems, historical databases and human inputs. Data is generated, transferred, processed and stored, from one system to another system, one company to another company.
Veracity is by DNV GL, and DNV GL has held a strong brand for more than 150 years as being a trusted 3rd party, yet it is still pretty common to hear questions from data consumers such as:
Can I trust the data I got from Veracity?
How was the data collected and processed?
In order to answer these questions and bring more transparency to the data process lifecycle, we must address both data integrity and data lineage. Both Data integrity and data lineage are the foundation of trust.
In this series of articles, we are going to look at different challenges of data integrity and lineage, and evolve the solution. (Note that integrity is one of the 3 parts of CIA triad: confidentiality, integrity and availability, but we will not cover confidentiality and availability in this series.)
Data Integrity
Let’s start with a basic example: Alice sends messages (ie. files) to Bob. The messages were sent via an insecure channel, such as http-based data transfer, ftp, file share or even an USB stick.
Basic requirements:
There are 2 basic requirements for any data communication:
The messages were not tampered by man-in-the-middle.
The messages that Bob received, are indeed from Alice.
There are mainly 2 ways to ensure this: encryption and/or hashing. (A nice articles for comparing hashing and encryption can be found at here.)
Iteration #1
In iteration 1 we focus on solving requirement #1: The messages were not tampered by man-in-the-middle. We either use encryption or hashing.
1.1 Using Encryption (with symmetric or asymmetric key)
Pro: Encryption is pretty straight forward: Either use symmetric or asymmetric key, Alice and Bob can encrypt and decrypt messages without worrying data tampering.
Con: However, this requires key management, both for Alice and Bob.
1.2 Using Hashing
Pro: Does not require key management for both Alice and Bob.
Con: With hashing, it requires an additional data flow for passing hash values from Alice to Bob. It actually requires the same security mechanism as the normal data flow.
We can address the Con by introducing a trusted area for Alice. For example, Alice also publishes the hash values of the messages on https://alice.com. Bob can verify the message by compare the hash values. It is also OK to make the trusted area public, as hash value is irreversible - nobody can obtain the data by using the hash value, they can only check the message integrity.
This solution is sort of adding a secured “safeguard” track on the side, to help verifying the data flowing in the insecure channel.
Pro: Does not require key management for both Alice and Bob. Solved the problem for protecting hash value data flow.
Iteration #2
In iteration #2, in additional to requirement #1, we also need to also fulfill requirement #2: The messages that Bob received, are indeed from Alice.
2.1 Using Encryption (with Asymmetric key)
This normally requires asymmetric encryption: Alice encrypts the message with her private key, and Bob decrypts it with Alice’s public key. Therefore, Bob is confident that Alice is the message author.
2.2 Using Hashing (with a trusted area), same as iteration #1
Hashing solution with a trusted area can also meet this requirement, simply counting on ONLY Alice can write into the trusted area.
Conclusion of iteration #1 and #2
For ensuring the basic requirements, both solutions work:
Using Encryption (with asymmetric key), and
Using Hashing (with trusted area)
Challenge of accountability and non-repudiation
Now, an interesting real challenge: Once Alice sends out a message, she can neither deny the message was sent, the message’s origin nor the original content. In another word, the challenge is about accountability and non-repudiation.
It can be explained by the following example: (click to enlarge the picture)
At this point, these above solutions that we have so far cannot help Bob. For example, Alice can replace both the message and the hash value in https://alice.com.
With encryption solution, although Bob can prove the buggy version of message #2 is from Alice, but he cannot prove that Alice sent out the buggy version on Monday.
In general, Bob (and we) need an immutable history that provides immutable traceability of data, such as when and what data was sent and processed.
It definitely helps provides data consumers like Bob, but there are benefits for well-behaved data providers as well: By offering the immutable history, it increases the data’s acceptance from that providers, as well as increases value and trust of the provider.
Iteration #3 - introduce DLT as immutable history
Distributed Ledger Technology (DLT) shows its potential capacity to become a natural place for storing data integrity and data lineage information, as it has the following key features:
Data Immutability As the data is replicated in all nodes in the DLT network, it means that the data is immutable, even the author cannot modify his/her records once it is confirmed in ledgers.
Decentralized The ledger network is decentralized, means all participators have the same copy of the data, including Alice and Bob. There is not a central authority can control the whole network and the records in it.
Built-in authentication In order to send data to the ledger, the author must use his/her private key. It provides the built-in authentication for identifying who is the author of the data/transaction.
3.1 Encrypted message within DLT
As DLT does support built-authentication, there is no need to use asymmetric(public/private) key for identity purpose. You can still use symmetric key for protecting the message from unauthorized access. However, there are some limitations for using DLT as the secured channel. The biggest one is the size limitation of the message. For example, bitcoin size limitation is 1 MB and ethereum is of similar size. For lots of the cases, this limitation is show-stopper.
Therefore, the hashing solution with DLT is more realizable. See below.
3.2 Hashing with DLT
By only putting hash value of the messages into DLT, we can solve the size limitation issue. It means:
Alice continues to send messages via the insecure channels.
Meanwhile, Alice sends the hash values of the message into DLT.
All hash values that Alice sent to DLT, is signed by Alice’s private key. So everyone knows it was author (Alice), the original message’s digest and when the data was sent (timestamp).
Once Bob received the message via insecure channel, he can
Find the transaction that contains the hash value for that message from DLT
By check the transaction’s metadata, Bob can check the author and timestamp.
By check the hash value from that transaction, Bob can verify the message content is not tampered.
Also, it is impossible for Alice want to replace an old hash value. So Bob is protected from an immutable history.
Data Lineage
The goal of data lineage is to track data over its entire lifecycle, to gain a better understanding of what happens to data as it moves through the course of its life. It increases trust and acceptance of result of data process. It also helps to trace errors back to the root cause, and comply with laws and regulations. You can easily compare this with the traditional supply chain of raw materials in manufacturing industry and/or logistic industry.
For example, Bob is running a data process. This process takes inputs from Alice, then produces results. The results are sent to Carol.
Bob produces result #X, based on inputs from Alice #1 and #2.
Bob produces result #Y, based on input from Alice #3.
For Carol, some typical questions are:
What inputs Bob used for producing the results #X and #Y?
Do these inputs also have another input? If yes, what are they?
Is there a way to have to full picture of the whole data process lifecycle, without asking Bob (and every upstream) in the supply chain?
Data Lineage with DLT
Now we continue building on top of the Hashing solution with DLT. Whenever a data provider (for example, Bob) sends out data, he writes into DLT that contains:
Hash value, which will be used for data integrity verification (same as before), and
If the data has inputs, the reference to the input are also stored into DLT
It means that the DLT contains the end-to-end data lifecycle information. Carol (and anyone else) only need to query the public information from DLT to build the lineage diagram.
With this solution, Carol can:
Gain the knowledge that that Bob is using data from Alice as inputs, without asking Bob.
Verify the data integrity for both Alice and Bob, even Carol does not directly consume the data from Alice.
Data integrity and data lineage information is immutable.
Extra protection for data processor
In above process, Bob is a data processor that accepts inputs from Alice (upstream), process it and send results to Carol (downstream).
This solution also provides an extra protection for Bob. For example, if Bob sent a data to Carol based on an incorrect input from Alice, Bob can simply explain that the root cause of the error is not on him but Alice, and Alice cannot deny that.
This also means this solution can greatly simplifying the ability to trace errors back to the root cause, even the whole process includes different parties/organizations.
Conclusion
Now we have went through different requirements and evolved solutions accordingly. At the end we believe the hashing solution with DLT can solve both data integrity and data lineage challenges. If the eco-system (data source, data processors and platform) can follows the same design, it will significantly increase the trust of data consumers as well as build more value into the data.
In the next article, we will look at this solution in action, by using IOTA as the selected DLT.
]]>
<p><strong>Other articles in this series:</strong></p>
<ul>
<li>Part 1 (this article)</li>
<li><a href="http://feng.lu/2018/10/03/Data-Integrity-and-Lineage-by-using-DLT-Part-2/">Part 2</a> </li>
<li><a href="http://feng.lu/2019/01/03/Data-Integrity-and-Lineage-by-using-DLT-Part-3/">Part 3</a></li>
</ul>
<h1 id="Introduction"><a href="#Introduction" class="headerlink" title="Introduction"></a>Introduction</h1><p>With the proliferation of data – collecting and storing it, sharing it, mining it for gains – a basic question goes unanswered: is this data even good? The quality of data is of utmost concern because you can’t do meaningful analysis on data which you can’t trust. Here in Veracity, we are trying to address this is very concern. This is a 3 part series, going all the way from concept to a working implementation using DLT (Distributed Ledger Technology).</p>
<p>Side note, Veracity is designed to help companies unlock, qualify, combine and prepare data for analytics and benchmarking. It helps data providers to easily onboard data to the platform, and enable data consumers to access and mine value. The data can be from various sources, such as sensors and edge devices, production systems, historical databases and human inputs. Data is generated, transferred, processed and stored, from one system to another system, one company to another company. </p>
<p>Veracity is by DNV GL, and DNV GL has held a strong brand for more than 150 years as being a trusted 3rd party, yet it is still pretty common to hear questions from data consumers such as:</p>
<ol>
<li>Can I trust the data I got from Veracity? </li>
<li>How was the data collected and processed?</li>
</ol>
<img src="/2018/09/25/Data-Integrity-and-Lineage-by-using-DLT-Part-1/Blackbox%20in%20data%20platform.png" class="">
Using new domain feng.luhttps://feng.lu/2018/08/27/Using-new-domain-feng-lu/2018-08-27T19:13:52.000Z2021-11-17T19:10:29.744ZShortly after I have renewed my blog domain fenglu.me, it just crossed my mind that “hey, is it possible to register a top-level domain with my family name .lu? So I can literally have my name for my site: feng.lu! That will be cool!”
And, (after googling), yes! It is possible! .lu is the Internet country code top-level domain for Luxembourg. OK… (continue googling) “Can I register a .lu domain without been a Luxembourgers?” “No problem!” Great!
Long story short, after some quick research on vendors and paid 24 Euro, I got the brand new feng.lu domain! :)
The remaining is pretty straightforward:
In feng.lu domain provider, set up an apex domain and www subdomain for my real blog host Github page, according to their document.
In github page settings, update the custom domain (equals to update the CNAME file).
Update blog source code (hexo) with the new domain
Important!: Since I would like to keep all existing links from the old domain fenglu.me continue working, I also setup the domain forwarding. Document. Remember to use “Redirect to a specific page/folder/subfolder”.
Update Google Analytics, GTM, etc
Done!
Happy blogging!
]]>
<p>Shortly after I have renewed my blog domain <strong>fenglu.me</strong>, it just crossed my mind that “hey, is it possible to register a t
Data Integrity and Lineage by using IOTAhttps://feng.lu/2018/04/16/Data-integrity-and-data-lineage-by-using-IOTA/2018-04-16T09:22:13.000Z2021-11-17T19:10:29.397ZEdit log:
2018.09.25 This article is now expanded to an article series, where we have more detailed discussion and open-source code, check them out!
2018.08.26 - Updated the data schema:
Have an unified format that covers both lightweight format and standard format, but more flexible and self-explained.
Specified mandatory fields and optional field in the format. For example, Timestamp is now an optional field.
Introduction
If we say “Data is the new oil”, then data lineage is an issue that we must to solve. Various data sets are generated (most likely by sensors), transferred, processed, aggregated and flowed from upstream to downstream.
The goal of data lineage is to track data over its entire lifecycle, to gain a better understanding of what happens to data as it moves through the course of its life. It increases trust and acceptance of result of data process. It also helps to trace errors back to the root cause, and comply with laws and regulations.
You can easily compare this with the traditional supply chain of raw materials in manufacturing industry and/or logistic industry. However, compares to the traditional industries, data lineage are facing new challenges.
Data lineage challenges
Some top challenges are:
We are tracking logical entities (bits, files or data streams) instead of physical entities (coal, car parts or packages).
The granularity of data has much more detailed scale in IoT and Big Data world. One example is, tracking every single piece of coal from a carrier ship sounds crazy, but tracking every data signal from thousands sensors from the very same ship is quite common.
Also, protecting logical entities is even harder in the cyberspace, both in data transportation and storage.
In addition,
Data lineage is built on top of data integrity, which has to be solved first.
We need a neutral and trustworthy 3rd-party for keeping both data integrity and data lineage information, as most likely the upstream (supplier) and downstream (consumer) are different organization.
Technologies
Distributed Ledger Technology (DLT) shows its potential capacity to become the neutral and trustworthy 3rd party in data lineage world, as it has the following key features:
Data Immutable
Decentralized
But not all DLT are suitable for Big Data or IoT scenarios, when we have, for example, following requirements:
Need to use DLT to store large amount of data (e.g. data integrity information of thousands of sensors)
Need to use DLT to handle large volume of transactions within a short time period (e.g. send 1000 data points from one device to another device per minute)
Cannot afford high transaction fee
Therefore, IOTA becomes an outstanding DTL compares to other blockchain platform, by offering the following features:
Data Integrity/Security: All data cryptographically secured in a Tangle. This data can be made visible to certain parties.
Zero Transaction Fee: Machine to Machine micropayments. This way machines can pay each other for certain services and resources.
But most importantly, it brings Masked Authenticated Messaging (MAM) which fits into our need for data integrity and data lineage.
Masked Authenticated Messaging (MAM)
Masked Authenticated Messaging (MAM) was introduced by IOTA in Nov 2017. The high level description can be found at here. Besides, some deep dive information of Tangle transaction and MAM can be found at:
1. Data integrity is the foundation of data lineage
Data Integrity is the prerequisite of Data Lineage, and they can be addressed separately.
2. Self-service verification process
The verification process of both data integrity and data lineage should be self-service. It means that all verification information should be available to public. Data provider should not be bothered by this process. (Technically it is possible to have permission control of the verification process, it means that data provider has to response to the ad-hoc verification requests)
3. Data lineage verification is an add-on on the side of the main data-flow
It means that data lineage will not impact the existing data flow, nor become bottleneck.
Conceptual Entities
Data Source
A sensor, person, application that generates data package (s)
Has 0 or more inputs (upstream data source)
Has 1 or more outputs (downstream data source)
A company can have more than one data sources
Data Package
An atomic unit in data flow from one data source to another data source. For example:
A data point (23 degree at 10:30am), or
A file (json, xml)
Files (1.json, 2.json…10.json…)
Data rows in a database (row #1 to row #10 in table “employee”)
Data Package Id
The unique ID of a data package in the scope of a data source. A typical data package id is a number, a GUID or a time-stamp.
Data Stream
Data stream is data package series from the same data source. It contains more than more packages and their IDs.
Solution Part 1: Data Integrity
Goal: One can verify the integrity of data packages from a data source.
Step A. Data source creates a MAM channel for publishing integrity information
Data source creates a public MAM public channel by using its private seed. The private seed ensures only the the data source can publish information into that channel, and so the channel is trusted by others.
Step B. Decide your integrity information content
In order to allow the consumer to verify the integrity, you need to provide enough information to make it possible. Therefore you need to decide what information should be stored in the tangle as json object.
Mandatory fields
All object must have the following core fields. All of them are mandatory.
| Field | Description | Example | |—|—|—| | datapackageId | The package ID is used for querying the data lineage info from the channel. Data source decides the ID format, such as integer or GUID. Different channels can have the same package ID. | “123456” | | wayofProof | Information about how to verify the integrity based on valueOfProof. For example, it explains the used hash algorithms (SHA1 or SHA2 or others), or it simply copied the data package content into field valueOfProof. | “SHA256(packageId, original-data-content)” | | valueOfProof | The value of the proof, such as hash value, or the copy of the data content in clear text. | (hash value or data itself) |
Case 1 A temperature sensor decides to use timestamp as package Id, and since the data point is small and not confidential, it decides to put the data point as clear text in the integrity information object.
Therefore, at 2012-08-29 11:38:22, the temperature is 20 degree. It sends the integrity json into its own MAM channel:
1 2 3 4 5
{ datapackageId: "1346236702", wayofProof:"copy of original data", valueOfProof:"20" }
Case 2 An application generates big csv files and pass to the down stream. all csv files have an unique file name. Since we do not have do expose the csv file itself, either due to confidentiality or huge file size, it decides to use hash value in the integrity json. The hash function can be one of the Secure Hash Algorithms, such as SHA-512/256. This application decide to hash the file content together with the filename.
therefore, for file with unique name “file075.csv”, the application computed the hash based on SHA256(“file075.csv”+”:”+filecontent.string()), which is “8c20f3d24…43a6cfb7c4”
The hash is also useful if you wanna reduce the data sent to tangle. For example, a data source is generating a small file per second. However, pushing data to tangle in every second can be a performance bottleneck. If the data source pack all files of every 10 minutes into one, assign an ID and compute the hash value of this data trunk, it can still publish integrity data into tangle but with much lower frequency.
Extend it with optional fields
In addition to the above mandatory fields, you can extend the json object by adding more additional fields for fitting your logic.
For example, for case 1, you can add a field “location” for storing the location of that sensor, and “sensorType” of sensor type. These fields will be tightly coupled with these core fields, and stored in the tangle.
1 2 3 4 5 6 7 8 9 10
{ datapackageId: "1346236702", wayofProof:"copy of original data", valueOfProof:"20", location:"Oslo", sensorType:"temperature sensor XY200", ... additionalField:... ... }
Note “timestamp” is not a mandatory field, as all transactions in Tangle already has a system timestamp shows when the data was submitted to the tangle. You can add “timestamp” field to store when the original data was collected.
Step C. Data source send data integrity information to the channel
Data source sends data or hash value of the data to the MAM channel (IOTA tangle), it ensures:
Data verification information is immutable
Can verify the integrity with or without have access to data itself (hash)
Performance is acceptable (assuming IOTA can handle large volume of data from devices)
Generate a random seed and create a public MAM channel
Accept inputs from keyboard and send it to tangle as json format
Once the message was sent do tangle, everyone can query the tangle and read it. But none can change it since it is immutable. You can read the MAM message by using a good tool https://iota-mam-explorer.now.sh/.
Step D. Data source publish information of the channel
Data source publish (on web site or equivalent) the following information for anyone who wants to verify the integrity:
Root address of the MAM channel (NOT the private seed!)
Step E. Data consumer to verify the integrity
If a data consumer would like to verify the data he/she got from the data source is not tampered, the consumer can:
Obtain the MAM channel root address of the data source
read the “wayOfProof” to understand how to check the “valueOfProof” field. For example:
if “wayOfProof” is “copy of original data”, then simply compare the value from tangle and value from received package.
if “wayOfProof” is “SHA256(“file075.csv”+”:”+filecontent.string())”, the perform the same hash locally, the compare the result with the value from “valueOfProof”
Overview of data integrity workflow
Solution Part 2: Data Lineage
A case study
Lets look at an real life case:
You as an American tourist was having an vacation in Norway. You were driving a car and had a great experience of the fjord. Unfortunately you had a small accident outside of a gas station, and the car windshield was damaged (but lucky, no one has been injured). The local police station was informed and issued a form (in Norwegian!) about this accident.
Now you would like to report this to your insurance company.
Most likely the insurance company would like to know if they can trust the damage report. You can of course explain that the data flow is:
The police station in Norway issued a statement in Norwegian “2018 20. februar 13:00: En liten bilulykke utenfor Esso bensinstasjon på Billingstadsletta 9, 1396 Billingstad. Bilskade: 5000 NOK.”
Since the US based insurance company only accept documents in English, a translation provider helped to translated this statement from Norwegian to English: “2018 Feb 20th, 13:00PM: A small car accident outside of Esso gas station at Billingstadsletta 9, 1396 Billingstad.Car damage: 5000 NOK. “
The next step is to convert the currency 5000 NOK to US Dollar, according to the currency rate of 2018 Feb 20th, as well as provide a map for describing the location of the accident. Therefore a currency converter and a geolocation service provider were involved for providing data.
If we can store and verify this flow (data lineage of the report), it will:
Provide full traceability of the end-to-end process
Save huge cost from insurance company by reducing the time consuming manual verification process
Immutable histories of all inputs of the report. It also help to identify responsibility of any false input.
Solution Design
On the top of the data integrity layer that we discussed above, it is easy to extend the format to build the data lineage layer.
Now we extend the format to include an optional field inputs, which is an array of MAM addresses. These addresses represent the data integrity information of all inputs of the current data package.
Depends on if you have any input, inputs is optional. You can ignore this field, or have this field but the value is null.
By using the additional inputs field, it is easy to establish the follow data lineage flow:
It means that
The insurance company can verify the report#33 is indeed from the report generator and it was not tampered.
By following the inputs fields, the insurance company can also find all upstream and data origin in report#33, and verify the integrity of them as well.
It also helps, for example, if there is a mistake of the currency convert from NOK to USD, it is the currency converter, not the report generator (customer), to take the responsibility.
Conclusion
Data integrity and data lineage play important roles in the coming data-first era. By using DLT, especially IOTA, it is possible to build the infrastructure of them. However, we have to keep in mind, even IOTA looks promising, it is under development, and it is not production ready. We will continue our investigation and collaboration with IOTA team/communities to continue this journey.
]]>
<h3 id="Edit-log"><a href="#Edit-log" class="headerlink" title="Edit log:"></a>Edit log:</h3><p>2018.09.25<br>This article is now expanded to an article series, where we have more detailed discussion and open-source code, <a href="http://feng.lu/2018/09/25/Data-Integrity-and-Lineage-by-using-DLT-Part-1/">check them out!</a> </p>
<p>2018.08.26 - Updated the data schema:</p>
<ol>
<li>Have an unified format that covers both lightweight format and standard format, but more flexible and self-explained.</li>
<li>Specified mandatory fields and optional field in the format. For example, Timestamp is now an optional field.</li>
</ol>
<h1 id="Introduction"><a href="#Introduction" class="headerlink" title="Introduction"></a>Introduction</h1><p>If we say “Data is the new oil”, then <a href="https://en.wikipedia.org/wiki/Data_lineage">data lineage</a> is an issue that we must to solve. Various data sets are generated (most likely by sensors), transferred, processed, aggregated and flowed from upstream to downstream. </p>
<p>The goal of data lineage is to track data over its entire lifecycle, to gain a better understanding of what happens to data as it moves through the course of its life. It increases trust and acceptance of result of data process. It also helps to trace errors back to the root cause, and comply with laws and regulations.</p>
<img src="/2018/04/16/Data-integrity-and-data-lineage-by-using-IOTA/Data%20lineage%20visualization.png" class="" title="Example of data lineage visualization, for Report 1, 2 and 3">
<p>You can easily compare this with the traditional supply chain of raw materials in manufacturing industry and/or logistic industry. However, compares to the traditional industries, data lineage are facing new challenges.</p>
Running IOTA Full Nodehttps://feng.lu/2018/02/19/Running-IOTA-Full-Node/2018-02-19T21:29:05.000Z2021-11-17T19:10:29.736ZI have been looking at IOTA since last winter, as it seems promising for IoT, Machine-to-Machine Micro-payments and Data Market scenarios.
Installing an IOTA light wallet is pretty straightforward, but running a full node is not. But thanks to the great playbook, I managed to setup a Virtual Private Server to run as an IOTA full node.
Enabled remote access for the node, so the light wallet can connect to it.
Setup firewall rules to allow IOTA node talking to internet
Setup DNS to make the node more friendly for my neighbors
Found good neighbors from IOTA Discord #nodesharing channel Tips: go to #rank-yourself and type “!rank fullnode”, then you’ll get access to the #nodesharing channel
Security!
There are lots of things you need to think about when you are hosting a 24/7 server on the internet. This blog and Security Hardening section provides a good guideline.
Use SSH key access
Disable password authentication
Disable SSH root access
In addition, if you are using the playbook installer , you basically have the default user name and ports for your full node. IT IS IMPORTANT TO CHANGE THEM! Otherwise the attacker only need to crack the password, as they already know your user name (iotapm) and your ports.
Update user name and password in bash
1 2 3 4 5 6 7 8 9
nano /opt/iri-playbook/group_vars/all/iotapm.yml
#update the following values
iotapm_nginx_user: new_user_account
iotapm_nginx_password: 'a-strong-password'

nano /opt/iri-playbook/group_vars/all/z-override-iotapm.yml
#update the following values
iotapm_nginx_user: new_user_account
iotapm_nginx_password: 'a-strong-password'
If you are looking for neighbors, or would like to connect your wallet to this node, please feel free to let me know. If you would like to donate, please use the following address. :)
]]>
<p>I have been looking at <a href="https://www.iota.org/">IOTA</a> since last winter, as it seems promising for IoT, Machine-to-Machine Micro-payments and Data Market scenarios.</p>
<p>Installing an IOTA light wallet is pretty straightforward, but running a full node is not. But thanks to the great <a href="http://iri-playbook.readthedocs.io/en/master/introduction.html">playbook</a>, I managed to setup a Virtual Private Server to run as an IOTA full node. </p>
<ul>
<li>2 cores CPU </li>
<li>4 GM memory</li>
<li>SSD </li>
<li>Hosted 24/7 in a data center in Western Europe</li>
</ul>
<img src="/2018/02/19/Running-IOTA-Full-Node/IOTA%20Field.png" class="" title="Connected full nodes in IOTA field map">
Infrastructure-as-Code and CI/CD in the real world, with VSTS and Azure (Part 1)https://feng.lu/2017/11/05/Infrastructure-as-code-in-the-real-world/2017-11-05T10:13:36.000Z2021-11-17T19:10:29.687ZHello again!
It has be been a while since my last post. It is because I was quite busy leading a team in a program for delivering veracity.com, the open industry data platform from DNV GL. It is a pretty exciting project - to build an open, independent data platform with bleeding edge technologies, to serve a large user base (100 000 registered users). You can read more about veracity at here and here.
It actually is a long and interesting story behind veracity (and its predecessor), together with all challenges that we encountered in this journey. Hopefully I can share them with you in the future.
Anyway, today I would like to talk about in the real world, how Infrastructure-as-Code looks like, together with Azure and VSTS.
Challenges
There are tons of azure templates which is a great start point to use Infrastructure-as-Code in Azure. However, in the real world project, we always need to do a lot of extra work due to:
We need multiple environments such as Nightlybuild, Testing and Production environment.
Different environments are 90% identical, but we have to handle the 10% differences For example, we use more powerful App Service Plan in Production, but cheaper plan for Nightly build, in order to save the cost.
We cannot include secrets (e.g. database password and keys) in version control.
We want to release without downtime.
We want to release new version fast, with quality control
We do NOT like manual job!
Above introduces the complexity to the CI/CD process, so it is important to have some best practices and common understanding in the team.
Let’s start with something simple
Let’s start with something simple, then we evolve it overtime for addressing different challenges.
Lets say we are going to build a simple nodejs web application as following, and host it in Azure. This application is named “MyWords”.
It has 3 components:
An Azure App Service,
An Azure Storage Account, and
An Azure Application Insight The application setting of the web app contains the storage account connection string and application insight instrumentation key.
One environment, for the PoC
As a developer, you can simple go to Azure portal and create them manually. It is perfectly OK especially when you are building a PoC.
Create resource group
Create a app service
Create a storage account, copy the connection string into app settings of the web app.
Create an application-insight, and copy the instrumentation key into app settings of the web app.
Multiple environments, when things are getting real
Now as usual, when the project became serious, we need multiple environments for a better control. In this case, they are Nightlybuild, Testing and Production.
Nightlybuild: Every night we pull the latest code changes and deploy to this environment. Fully automatic process.
Testing: We would like to deploy the version that we have verified in NightlyBuild to Testing environment. The deployment process should be automatically but it requires manual approval, by Quality Assurance (QA).
Production: Fully automatic deployment process, but requires manual approval, by Product Owner (PO).
For now, these 3 environments are identical (of course, they are 3 different web app with different url, 3 storage accounts and 3 application-insight instances).
Now the manual steps from previous stage become tedious and time consuming, we would like to automate them.
At the end, we have our infra-as-code for our applications.
A basic skeleton of resource provisioning (see source code), and
The parameter file for Nightly Build environment (see source code)
The result of provisioning is
Testing Infra-as-code
It will be several iteration before you get the template right, but if your using VS2017, you can use some GUI for debugging.
VS2017 is simply calling the following command (Deploy-AzureResourceGroup.ps1 is a standard powershell that VS generated for you, you can also download it here)
It is nice to let the script to create resources for us, but there is only a hard-coded value that we specified in the json file is stored in application settings. Therefore we still have to manually copy keys and connection strings from application-insight and storage account into web site app settings.
In addtion, make sure we add dependencies into website resource, to make sure that we have created the storage account and application insight before the website is created
Now we have a basic infra-as-code that can provision multiple identical environments.
It can connect different resources together by automatically passing keys from resource to another.
We have tools and scripts to verify the infra-as-code
What is next?
In the coming articles, we will continue addressing the following challenges:
Different environments are 90% identical, but we have to handle the 10% differences
We cannot include secrets (e.g. database password and keys) in version control.
We want to release without downtime.
We want to release new version fast, with quality control
To be continued.
]]>
<p>Hello again! </p>
<p>It has be been a while since my last post. It is because I was quite busy leading a team in a program for delivering <a href="https://www.veracity.com">veracity.com</a>, the open industry data platform from DNV GL. It is a pretty exciting project - to build an open, independent data platform with bleeding edge technologies, to serve a large user base (100 000 registered users). You can read more about veracity at <a href="https://www.dnvgl.com/data-platform/index.html">here</a> and <a href="https://www.veracity.com/articles/why-we-build-veracity">here</a>.</p>
<p>It actually is a long and interesting story behind veracity (and its predecessor), together with all challenges that we encountered in this journey. Hopefully I can share them with you in the future.</p>
<p>Anyway, today I would like to talk about in the real world, how Infrastructure-as-Code looks like, together with Azure and VSTS. </p>
<img src="/2017/11/05/Infrastructure-as-code-in-the-real-world/infrastructure-as-code.png" class="" title="picture credit: future-processing.pl">
OAuth in Azure AD B2C with Nodejshttps://feng.lu/2017/06/28/OAuth-in-Azure-AD-B2C-with-Nodejs/2017-06-28T12:54:24.000Z2021-11-17T19:10:29.723ZRecently we need to build a Nodejs single-page-application (SPA) solution that is using Azure AD B2C as the identity provider (idp). Since it is a single-page-application, we are going to use OAuth2 Implicit Flow.
This article demonstrates the basic steps for setting up both the server side (WebAPI) as well as the client application.
Setup your own Azure AD B2C
Create an Azure AD B2C tenant
First of all, let’s create an AAD B2C tenant with domain luconsultingb2c.onmicrosoft.com by following the steps in this document.
Then you can switch by using the top-right menu
If you want, you can connect the AAD to an existing Azure subscription
Create a Linkedin App to generate the client id and secret
Add Linkedin as an identity provider in AAD B2C, together with Email as local accounts
Remember to give it a meaningful name for your Linkedin idp, as the name will be used in the login page. (Do not use “LI” as the Microsoft article suggested)
Create policy
Now create a Signup/Signin prolicy by following the steps in Azure Active Directory B2C: Built-in policies. We name this policy “SiUpIn”, and it will be automatically renamed “B2C_1_SiUpIn” (the B2C_1_ fragment is automatically added)
When user sign up, I would like to ask for Given Name, Surname Name, Email Address, Display Name, Job Title and Country/Region
After sign in, I would like to have Display Name, Country/Region and Job Title to be included in the claim. In addition, I want to know the idp and if newUser is true, so select them.
HTTP protocol is allowed as far as it is for localhost. If it is external, we have to use HTTPS.
Even the App ID URI is marked as optional, this is needed to construct the scopes that are configured in you single page application’s code
Setup policy
Once Web API is registered, open the app’s Published Scopes blade and add any extra scopes you want. Note:
The scope is used for controlling permissions: an access token defines the permissions that are granted to the bearer of the token. The permissions are defined by you (the API owner) and you control what happens when your API receives a token with that permission.
In this case, I define 3 permission levels: “read”, “write” and “performXYZ”.
When the API receives a token that has the “read” value in the scope, the API will do actions that I think are okay for a user that has a “read” permission.
Microsoft document mentioned that there is a default scope “user_impersonation”, but it is not mandatory. AAD B2C doesn’t care what the permission values are. It simply ensures that scopes that are requested are valid and then generates a proper token when they are valid. It is up to you what you want your API to do when it receives an access token with a permission called “user_impersonation”. The “user_impersonation” scope is there by default because there needs to be at least one scope defined when a user requests a token, and you can use the “user_impersonation” to be that scope.
By default, applications are granted the ability to access the user’s profile via the “openid” permission, and generate refresh tokens via the “offline_access” permission. But you do NOT need to specify them here.
Write down the AppID URI and Published Scopes values, You will need them in your client application code. The format for calling will be “https://{tenent}/{AppID URI}/{scope value}”, for example “https://luconsultingb2c.onmicrosoft.com/B2CEchoWebAPI/performXYZ".
app.get("/hello", passport.authenticate('oauth-bearer', {session: false}), function (req, res) { var claims = req.authInfo; console.log('User info: ', req.user); console.log('Validated claims: ', claims); //do this ONLY if the required scope include "read" if (claims['scp'].split(" ").indexOf("read") >= 0) { // Service relies on the name claim. res.status(200).json({'name': claims['name']}); } else { console.log("Invalid Scope, 403"); res.status(403).json({'error': 'insufficient_scope'}); } } );
Now run it at local
And confirm that the endpoint is protected
Now the Web API part is done, let’s move to the client part.
<script class="pre">
    // The current application coordinates were pre-registered in a B2C tenant.
    var applicationConfig = {
        clientID: 'df8f3cb5-b668-4e11-a8ca-ad4f78cb87f4',
        authority: "https://login.microsoftonline.com/tfp/luconsultingb2c.onmicrosoft.com/b2c_1_siupin",

//use scope "read", as it is required in the Web API (see the webapi code in above)
        b2cScopes: ["https://luconsultingb2c.onmicrosoft.com/B2CEchoWebAPI/read"],
        webApi: 'http://localhost:5000/hello',
    };
</script>
Test
Look at the claim properties As you can see that most of the user properties are from my Linkedin profile. Since this is the first time I signin, the newUser is true.
Also verify that the new user is created in AAD B2C
]]>
<p>Recently we need to build a Nodejs single-page-application (SPA) solution that is using Azure AD B2C as the identity provider (idp). Since it is a single-page-application, we are going to use OAuth2 Implicit Flow.</p>
<img src="/2017/06/28/OAuth-in-Azure-AD-B2C-with-Nodejs/what-is-oauth.jpg" class="" title="picture credit:stormpath.com">
<p>This article demonstrates the basic steps for setting up both the server side (WebAPI) as well as the client application.</p>

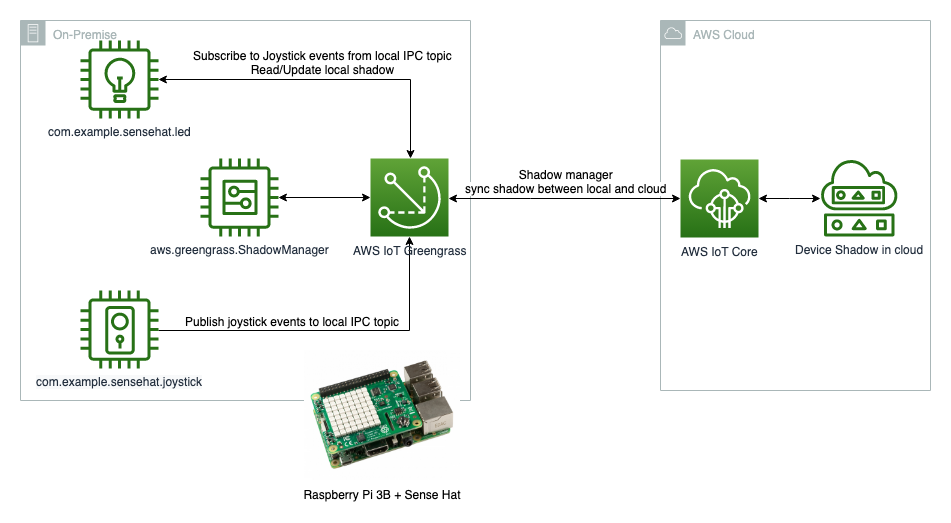
 ]]>
]]>


 (source: Microsoft)


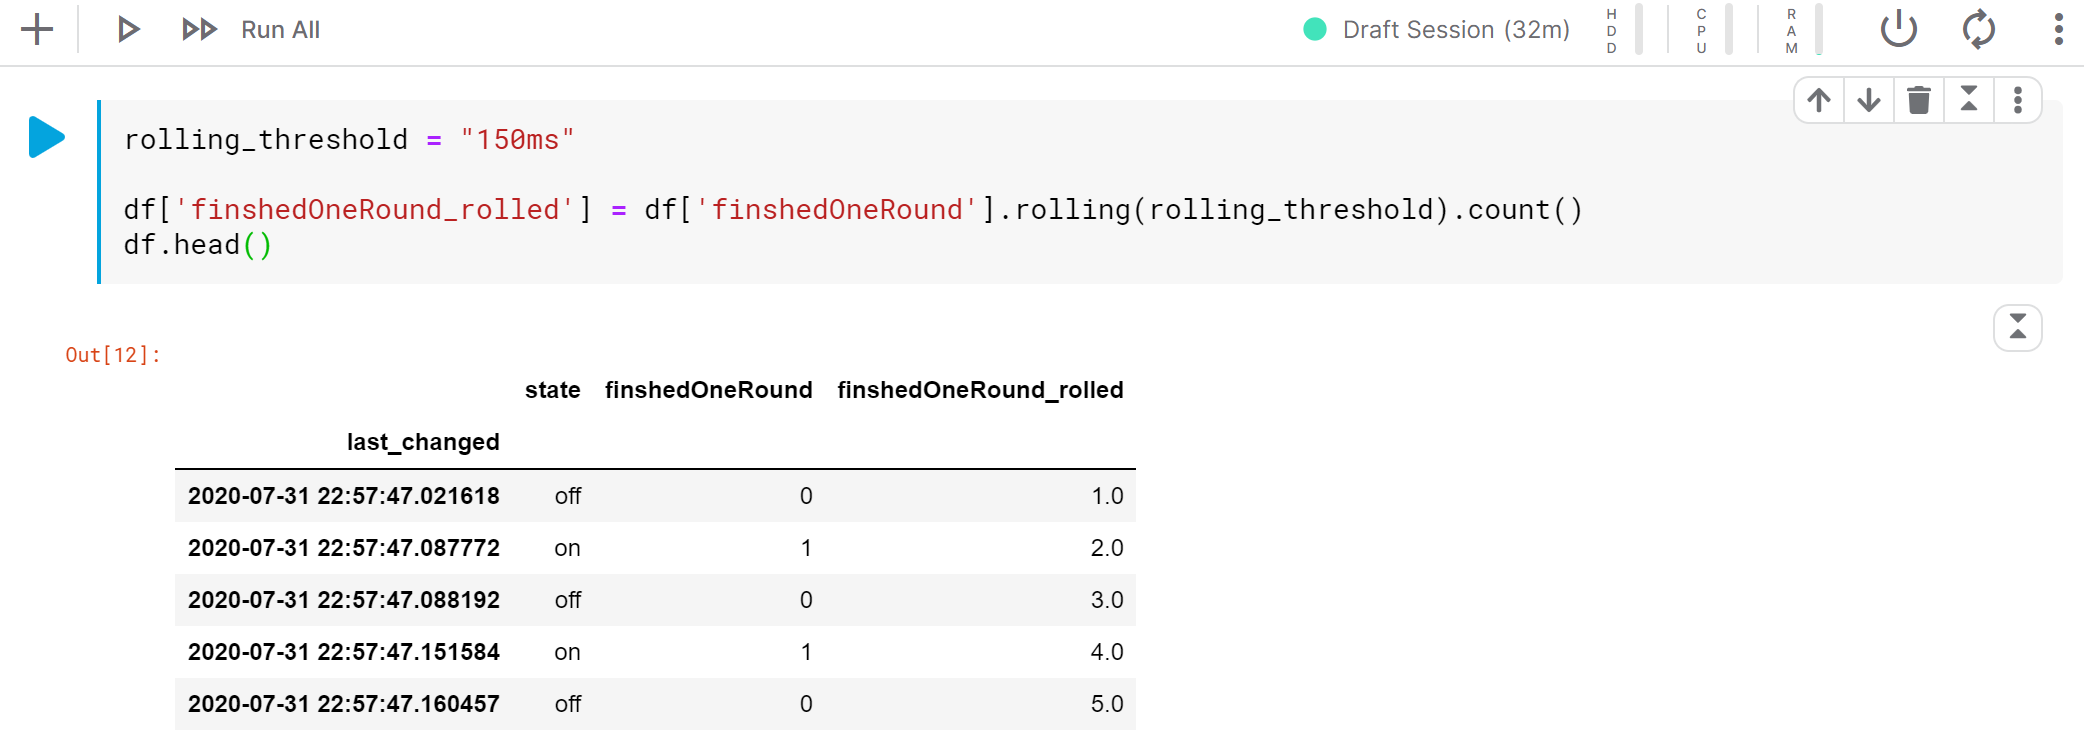
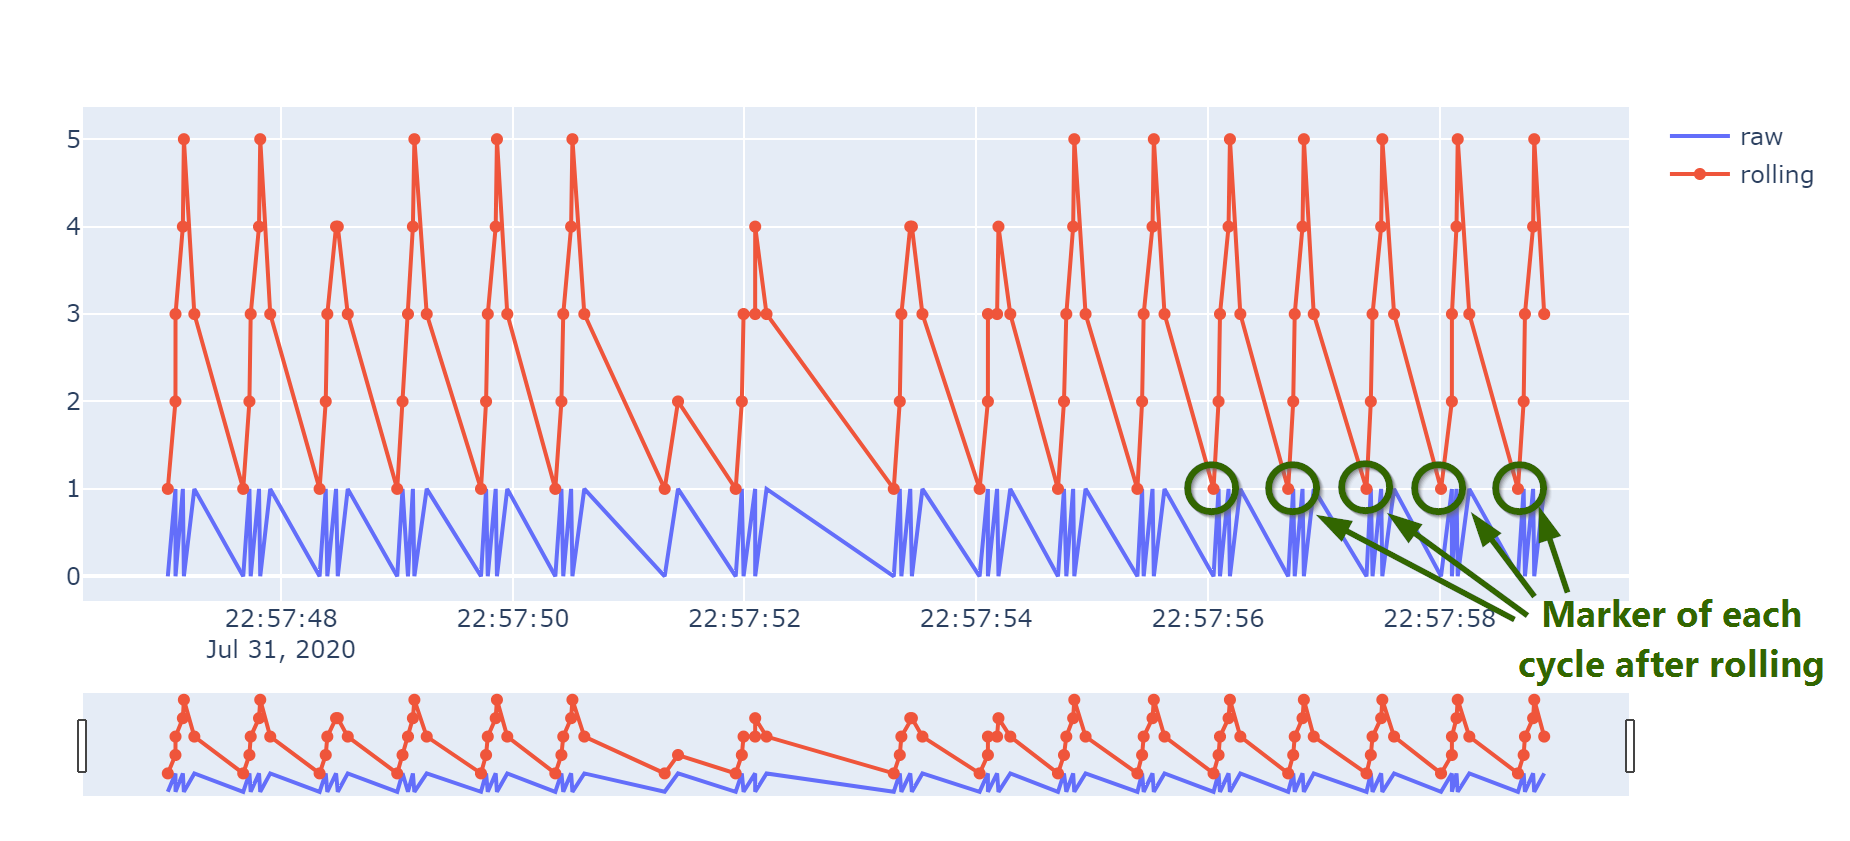
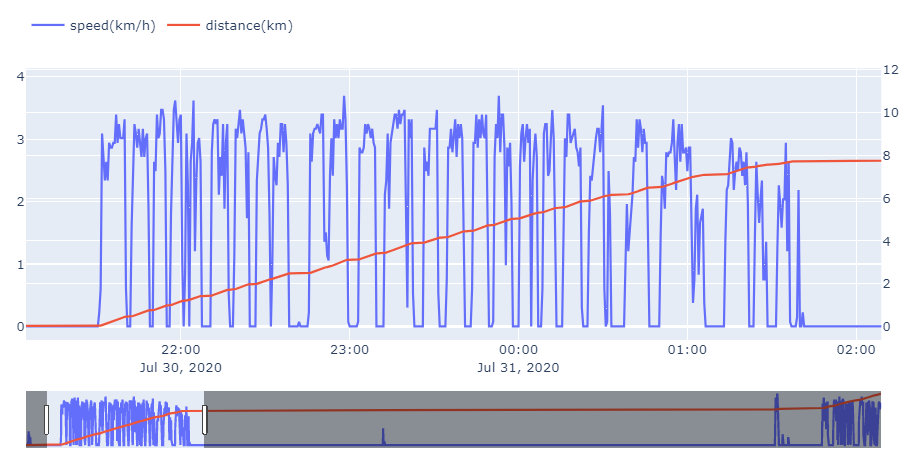
 ]]>
]]>
")


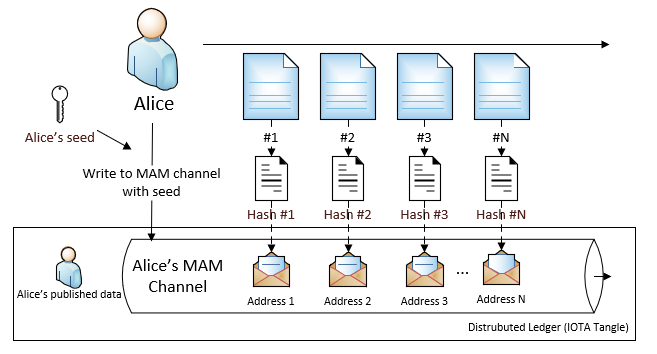


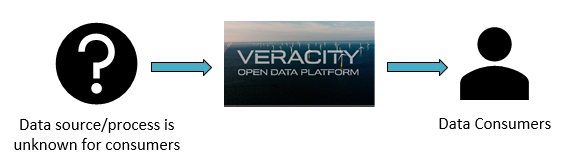


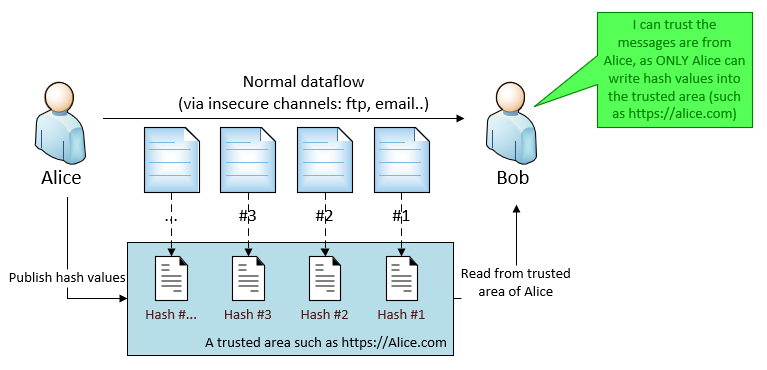


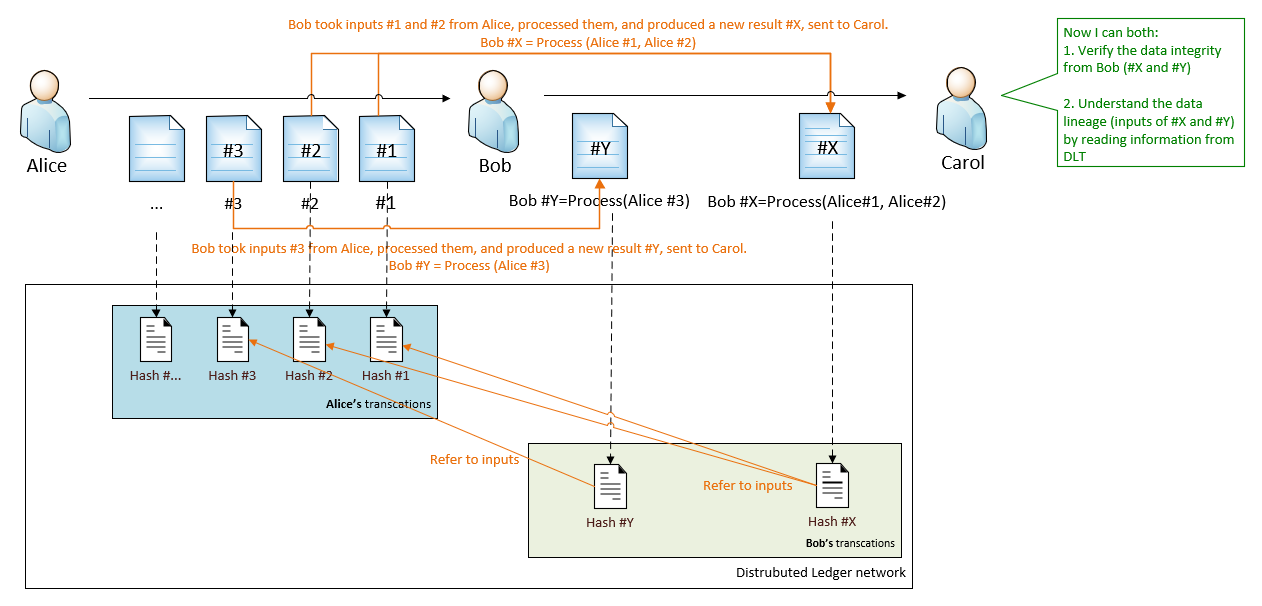
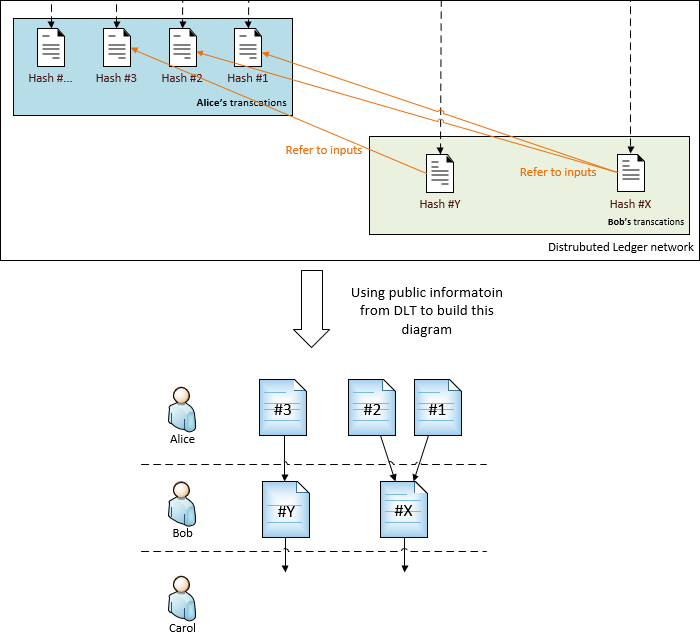
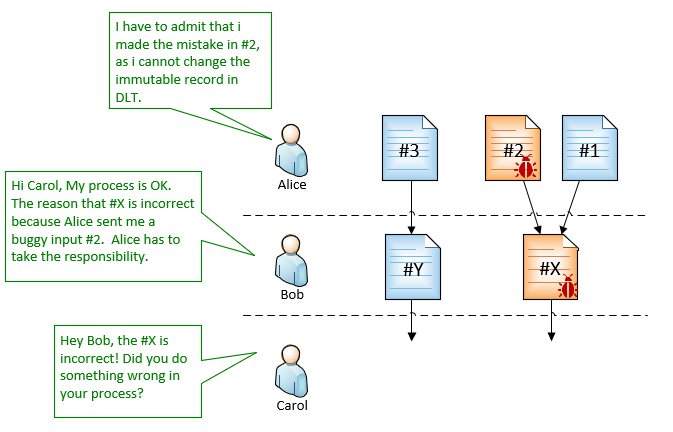
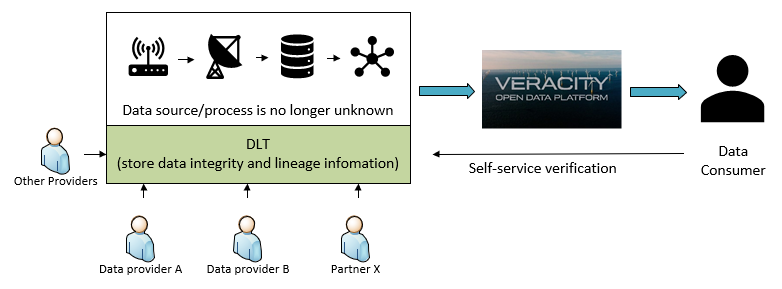


